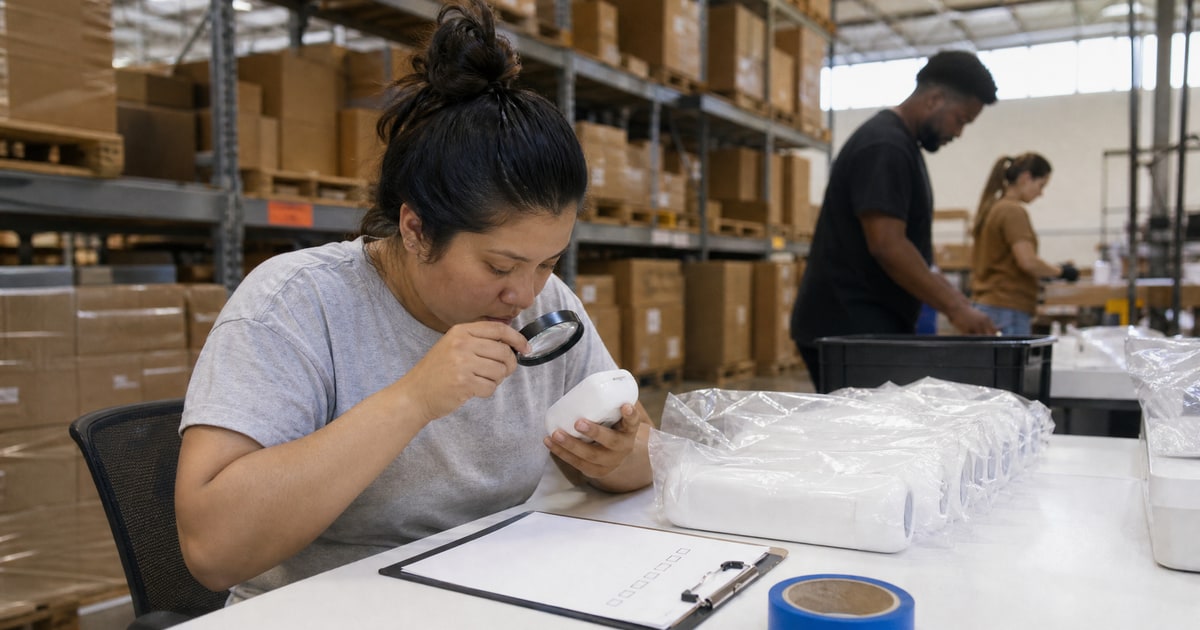
Treat one as evidence only when it names the baseline, the window, the spend behind the result, and the product stage. Then ask the question no case study answers, which is what share of that provider's brands reached profitability in their first year. One campaign is an anecdote, and the portfolio is the record.
The short version
- A case study is a chosen result. The provider picked it out of every account it ever ran, so read it as a sample of one.
- Four facts make it checkable. A dated starting point, a stated window, the spend, and the product stage.
- Ratios travel, revenue headlines do not. ACoS, TACoS, and ROAS compare across catalogs. A percentage jump in sales hides its base.
- The portfolio number outranks the campaign number. The majority of the brands we run reach profitability within their first year, and that is the shape of figure to demand.
- Ask for the account that did not work. A provider who cannot name one is handing you marketing instead of measurement.
What a real advertising case study shows
Most sellers read a case study for its headline number and stop. That number was chosen after the fact, so it names which metric moved and nothing about what moved it. The cost is a retainer signed on somebody else's best quarter.
Work these seven items in order. Each states what a study done properly puts on the page.
- A dated starting point. Done properly, the study names the metric before the work began and the month it was measured. Without that date, you cannot tell whether the account was already recovering.
- A window long enough to survive noise. Done properly, the study states how many weeks or months the change covers. One strong week proves that inventory arrived.
- The spend that bought the result. A return figure means nothing until the denominator is named. Done properly, the media spend and the management fee sit beside the sales number.
- The product stage. A launch runs an aggressive ACoS to buy velocity, and a mature product runs a tight one to defend margin. Done properly, the study says which of the two it reports.
- A ratio rather than a headline total. Done properly, the result reads as ACoS, TACoS, ROAS, or conversion rate, because those compare across catalogs.
- Everything else that moved in the same window. Done properly, the study names the price change, the promotion, the new creative, or the ranking gain that ran alongside the ads. Advertising takes credit for all of it when nobody separates them.
- A named person you can question. Done properly, the operator who ran the account joins the call and answers follow-ups without a deck.
A study clearing all seven is rare. Below five cleared, it is a brochure and should not reach your shortlist.
The number that outranks any case study
One account is one account. The figure that predicts your outcome is the share of a provider's brands that reach profit, and almost nobody publishes it. So ask what share of the brands they took on in the last two years reached profit inside twelve months, and how many brands that share covers.
Our answer is that the majority of the brands we run reach profitability within their first year. The denominator is 50 operators in Abu Dhabi running about 70 brands by hand. A percentage without a brand count is a sentence, not a record.
A smaller promise sits underneath it. After onboarding, a measurable ACoS improvement typically lands inside the first 30 days, on your own dashboard.
A study reporting ad metrics alone has skipped most of the account. When we decide whether a product earns more capital, we read four signals: rating trend, return rate, conversion rate, and cost of customer acquisition trajectory. Ad efficiency is not on that list, because it moves fastest and explains the least.
Our four public advertising results, held to the same seven items
Four of the nine brands on our results page carry an advertising figure. Here is each against the checklist.
| Brand | Published figure | What to ask us for |
|---|---|---|
| GrillX | ACoS 88% to 32% | The window and the spend |
| SnoreLessNow | TACoS 10.8% to 9.9% | The number of weeks |
| Vora Bowl | 5.7% TACoS at scale | The starting ratio |
| TuffTynz | 9.5x creator-ads return | Whether creators repeat it |
Figures as published on the Flapen results pages, captured 5 September 2026.
The outcome sentence on each page reads this way.
- GrillX, ACoS 88% to 32%. The worst-performing ad line rebuilt into a keeper, while sea freight negotiated to $1.04/kg kept the landed cost honest.
- SnoreLessNow, TACoS 10.8% to 9.9%. A multichannel sleep brand at six-figure weekly revenue. Ad efficiency improved while expanding into Walmart and the UK.
- Vora Bowl, 5.7% TACoS at scale. Record sales days on the most efficient ad account in the portfolio, with six-figure monthly targets carried on $5K of monthly spend.
- TuffTynz, 9.5x creator-ads return. $575 of creator spend returned $5,492 in sales, holding daily orders steady against a category down 22% on search volume.
Two of the four name their spend and two do not. So GrillX and SnoreLessNow clear item five and fail item three, which leaves them ratios awaiting a denominator. Ask us for that half, then ask every other provider the same.
What an agency will not tell you about its own case studies
Four things stay off the results page, ours included. Each has a version done properly.
- The denominator is never published. Three studies mean one thing out of a dozen accounts and something else out of hundreds. Done properly, the provider states how many accounts produced the three on the page.
- The failures were deleted. A page of wins means the losses were removed, which is standard practice here. Done properly, one study is an account that did not work, with the decision it changed.
- A ratio improves while profit falls. ACoS drops the moment you cut spend on the products carrying volume, and the chart reads as progress. Done properly, contribution margin sits next to the ad ratio for the same window.
- Nobody mentions the clients who left. Done properly, the provider names how many accounts it handed back last year and why, before you ask.
Hold us to all four. If we cannot show you an account that did not work and what we changed because of it, do not hire us.
Related answers
- Amazon ad types
- Amazon ad agency
- Fix suppressed listings on Amazon France
- How to fix suppressed listings found in an audit
- Amazon account measurement and audits: the complete guide
Do this before your next provider call, at no cost. Open one case study from each shortlisted provider and write four things beside it: the starting number with its date, the window, the spend, and the product stage.
Then count the blanks. The provider with the fewest is the one whose claims you can check.
To see those seven items applied to your own advertising, ask for the free written audit that comes back within 48 hours from Flapen.