x870e
Skip itBrand-locked demand (top 5 brands take 100% of clicks) — this niche doesn't clear our bar today.
Review moat
Great110.92avg incumbent reviews — the moat a new listing must climb
Quality gap
Good4.4★avg incumbent rating — lower means beatable quality
Competition
Good52%top-5 click share — leaders hold, buyers still browse
Market size
Okay€247K€247K/yr · 94K searches
Returns
Okay5.2%return rate — above 6% kills the launch gate
Avg price
Bad€351.62avg listing price — sweet spot $15–$100
Growth
Bad-17.1%90-day search growth — must beat 0% to launch
Conversion
Bad0.8%search→purchase rate — share of searches ending in a sale
Brand share
Bad100%top-5 brand share — brand-locked demand
Price range
Bad€189.88–€789.24cheapest to priciest tracked listing — scored on the share inside $15–$100
Competition
The top 5 products take 52% of clicks — established leaders, but buyers still shop beyond them.Brands
5 falling
Sellers
212
Top-5 brand share
100%
Open market
0%
- ASUS43%
- Gigabyte31%
- MSI23%
- ASRock2%
- NZXT1%
Product shelf
Each bubble is one product — market share against review moat; bubble size tracks estimated sales, color grades how beatable the incumbent looks.
All 25 tracked products in this niche — three views at once, no toggling.
Top sellers
by 90-day click share
GIGABYTE X870E A Elite WIFI7-Mainboard - Unterstützt AMD Ryzen 9000 CPUs 16+2+2 Phasen Digital-VRM bis zu 8000MHz DDR5 (OC) 3xPCIe 5.0 Wi-Fi 7 2.5GbE LAN USB 4
Gigabyte€225.454.6★194 rev
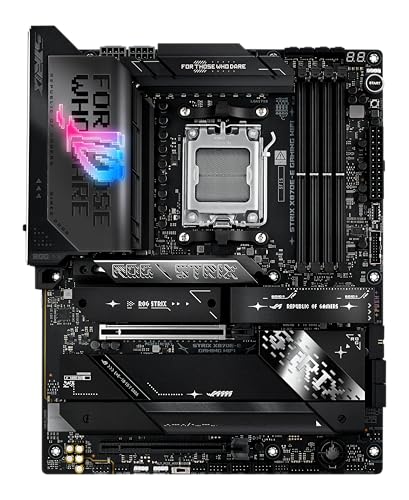
ASUS ROG Strix X870E-E Gaming Mainboard Sockel AM5 (AMD X870E ATX 18+2+2 Power Stages Dynamic OC Switcher Core Flex DDR5 WiFi 7 M.2 PCIe 5.0)
ASUS€345.444.4★353 rev
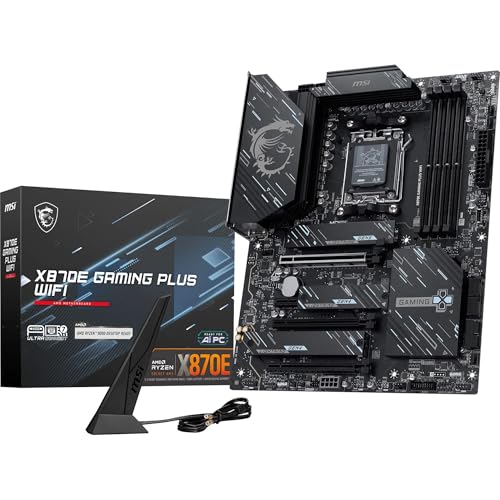
MSI X870E Gaming Plus WiFi Mainboard ATX - Unterstützt AMD Ryzen 9000/8000 / 7000 Prozessoren AM5-60A SPS VRM DDR5 Memory Boost 8200+ MT/s (OC) PCIe 5.0 x16 & 4.0 x4 M.2 Gen5 Wi-Fi 7 5G LAN
MSI€189.884.3★111 rev
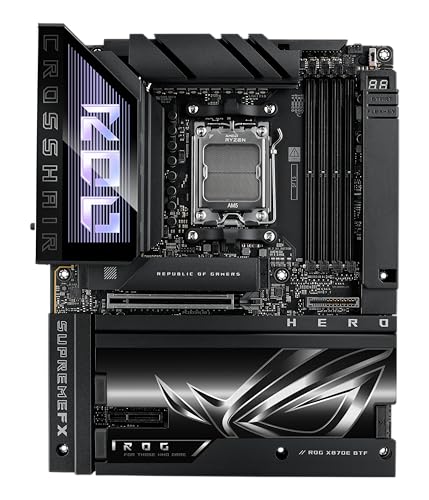
ASUS ROG CROSSHAIR X870E HERO Mainboard Sockel AM5 (AMD X870E ATX Advanced AI PC-ready 18+2+2 Power Stages Dynamic OC Switcher Core Flex DDR5 Wi-Fi 7 M.2 PCIe 5.0)
ASUS€459.904.5★205 rev

MSI MAG X870E Tomahawk WiFi Mainboard ATX - Unterstützt AMD Ryzen 9000/8000 / 7000 Prozessoren AM5-80A SPS VRM DDR5 Memory Boost 8400+ MT/s (OC) PCIe 5.0 x16 M.2 Gen5 Wi-Fi 7 5G LAN
MSI€248.524.2★331 rev
Newest
by launch date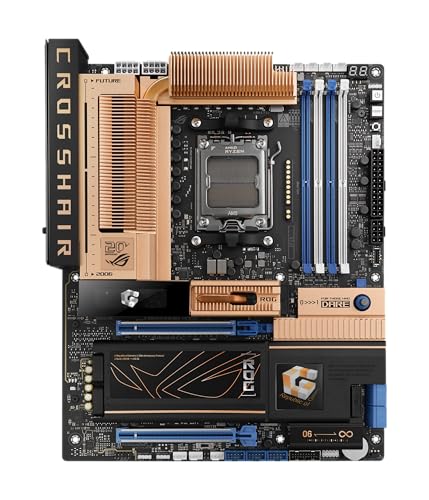
ASUS ROG Crosshair 2006 X870E WiFi 7 AMD ATX Mainboard (AMD AM5 20+2+2 Leistungsstufen DDR5 2-Zoll OLED Display 5X M.2 Steckplätze M.2 Q-Release PCIe 5.0 2X USB4 2X USB 20Gbps Typ-C)
ASUS€588.180 rev
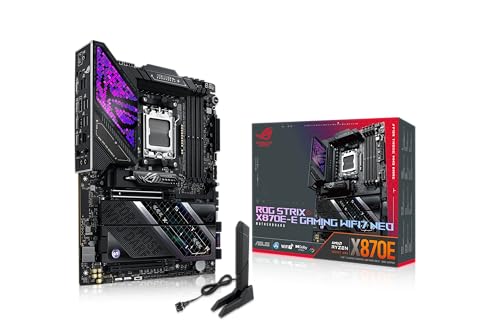
ASUS ROG Strix X870E-E Gaming WiFi7 Neo AMD ATX Mainboard (AMD AM5 18+2+2 Leistungsstufen DDR5 5X M.2 Steckplätze M.2 Q-Release PCIe 5.0 2X USB4 USB 10Gbps Typ-C Aura Sync RGB)
ASUS€427.090 rev

MSI MAG X870E Tomahawk MAX WiFi Mainboard ATX - Unterstützt AMD Ryzen 9000/8000 / 7000 Prozessoren AM5 - DDR5 Memory Boost (bis zu 8400+ MT/s OC) PCIe 5.0 x16 2X M.2 Gen5 Wi-Fi 7 5G LAN
MSI€268.145 rev
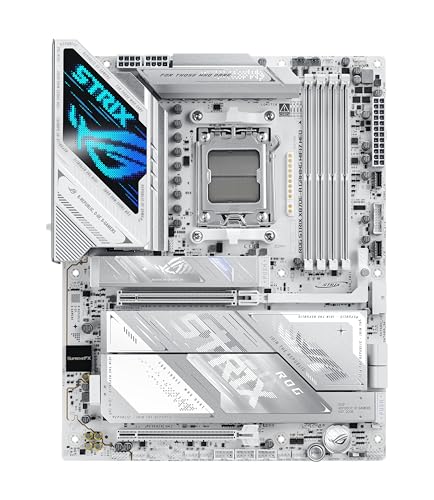
ASUS ROG Strix X870E-A Gaming WIFI7 NEO ATX Mainboard (AMD X870E 16+2+2 Leistungsstufen Dynamic OC Switcher Core Flex DDR5 mit AEMP & NitroPath DRAM 4X M.2 Steckplätze PCIe 5.0 x16 SafeSlot)
ASUS€378.482 rev
ASUS ROG Crosshair X870E Dark Hero Gaming Mainboard Sockel AMD AM5 (ATX DDR5 Advanced AI PC 10GB Ethernet WiFi 7 2X PCIe 5.0 M.2 2X USB4 2X USB 20Gbps)
ASUS€594.6811 rev
Trending
90-day click momentumASUS ROG Crosshair 2006 X870E WiFi 7 AMD ATX Mainboard (AMD AM5 20+2+2 Leistungsstufen DDR5 2-Zoll OLED Display 5X M.2 Steckplätze M.2 Q-Release PCIe 5.0 2X USB4 2X USB 20Gbps Typ-C)
ASUS€588.180.0★
ASUS ROG Strix X870E-E Gaming WiFi7 Neo AMD ATX Mainboard (AMD AM5 18+2+2 Leistungsstufen DDR5 5X M.2 Steckplätze M.2 Q-Release PCIe 5.0 2X USB4 USB 10Gbps Typ-C Aura Sync RGB)
ASUS€427.090.0★
ASUS ROG Strix X870E-A Gaming WIFI7 NEO ATX Mainboard (AMD X870E 16+2+2 Leistungsstufen Dynamic OC Switcher Core Flex DDR5 mit AEMP & NitroPath DRAM 4X M.2 Steckplätze PCIe 5.0 x16 SafeSlot)
ASUS€378.485.0★
MSI MAG X870E Tomahawk MAX WiFi Mainboard ATX - Unterstützt AMD Ryzen 9000/8000 / 7000 Prozessoren AM5 - DDR5 Memory Boost (bis zu 8400+ MT/s OC) PCIe 5.0 x16 2X M.2 Gen5 Wi-Fi 7 5G LAN
MSI€268.145.0★
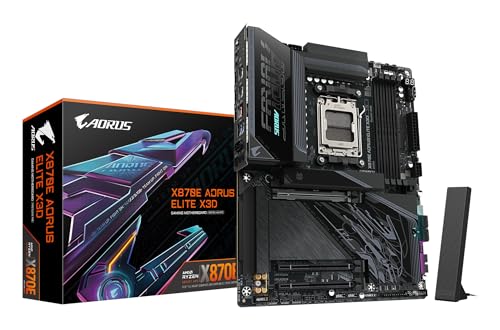
GIGABYTE X870E AORUS Elite X3D Mainboard Unterstützt AMD Ryzen 9000 Prozessoren 16+2+2-Phasen Digital-VRM bis zu 9000 Hz DDR5 (OC) 2 x PCIe 5.0 + 2 x PCIe 4.0 Wi-Fi 7 5 GbE LAN USB 4
Gigabyte€275.134.1★
Demand & seasonality
Weekly Amazon search volume, last 85 weeks — -17.1% search growth over the last 90 days.Peak months: Aug, Oct, Nov · busiest ÷ quietest = 2.6×
Reviews
What buyers praise and complain about, mined from review topics.What buyers love
“Leistungsstarkes High-End-Mainboard mit moderner Ausstattung”
“das Design modern”
“Die Installation verlief problemlos”
“Preis Leistung ok”
“Produkt wie beschrieben :D”
“innovativen" quick release für die GPU”
“Top-Leistung und stabile Performance”
“Hab das Board einige Monate in Betrieb und kann nicht klagen”
“WLAN läuft auch zuverlässig”
“Handhabung, bin mit der Leistung top zufrieden:)”
What buyers complain about
“Es besteht der Verdacht, dass es sich um ein bereits benutztes oder zurückgesendetes Produkt handelt”
“Teuer”
“Läuft leider nicht”
“Macht aber Probleme mit RAM”
“Board nach einbau nicht funktionstüchtig”
“Qualität top Software Totalschaden”
“Es gibt bessere Hersteller”
“Allerdings der Chipsatz wird im laufenden Betrieb bedenklich heiß”
“führt zu unnötigem Aufwand beim Zusammenbau”
“Läuft leider nicht”