Methodology
The science behind our niche scores
A niche is a group of Amazon products competing for the same buyers. The Flapen Score grades every niche we track from 0 to 100. It answers one question: how good this market is for a new seller. Most research tools are built to find you something. Ours is built to throw things out. This page shows how the number is made, how to read it, and what to do with it.
- Niches scored
- 193,753
- Pass rate
- 4.8%
The data
Where the data comes from
A score is only as good as its data. We read the public Amazon pages any shopper can see, around the clock, and rebuild the statistics twice an hour. Sales and conversion figures are estimates modeled from those pages. Amazon does not publish them, and we do not receive them. Every threshold on this page was calibrated against live niches. Not against opinion, and not against a spreadsheet someone built once and never checked.
The Flapen Score
Ten checks, one number
Every check answers one part of the same question. The question is whether a new seller can win share at a profit in a growing market. Ten weighted checks add up to one score out of 100. They sit in five groups: demand, competition, entry, price, and risk. Across the brands we audited and ran, nine in ten failures would have been flagged by the score alone.
Demand
40 points
Big Market
15 pointsHow much shoppers spend on these products in a year. A big market means a winning product can earn a lot, which makes the risk worth taking.
Trending
15 pointsHow much searches have grown in the last three months. A growing market keeps creating openings for new sellers.
High Conversion
10 pointsHow often a search turns into a sale. When buyers buy fast, you spend less on ads to win each sale.
Competition
25 points
Open Market
15 pointsThe share of clicks going to the five most popular products. When no product dominates, it's easier to capture your share of the market.
No Dominant Brand
10 pointsThe share of clicks going to the five biggest brands. When shoppers aren't attached to one brand, a new brand can enter.
Entry
15 points
Quality Gap
10 pointsThe average star rating of the products already selling here. Read the negative reviews to see what to fix, and aim for a product 0.2 stars above the niche average.
Low Review Barrier
5 pointsHow many reviews the average product here has. Plan to match that count before you sell at real volume.
Price
10 points
Avg price
5 pointsWhat products here typically sell for. Between $15 and $100 there's usually enough room to make money after fees.
Price range
5 pointsThe spread between the cheapest and priciest products here. When shoppers already pay a range of prices, there's room to position your own, including a premium version at the top.
Risk
10 points
Low Returns
10 pointsHow often orders get returned. Every return costs you money, so a niche with rare returns protects your profit.
Price is the exception. Every other check climbs. Price peaks between $15 and $100 and falls away on both sides. Below the window, fees eat the margin. Above it, impulse buying fades and the cash tied up per unit grows. Both price checks cap at 95 instead of 100, because a good price is table stakes, not an edge.
Eight of the ten checks score on the same thresholds that grade the raw number. So the badge next to a number and the points it earns never disagree.
A real niche, scored
How to read the card
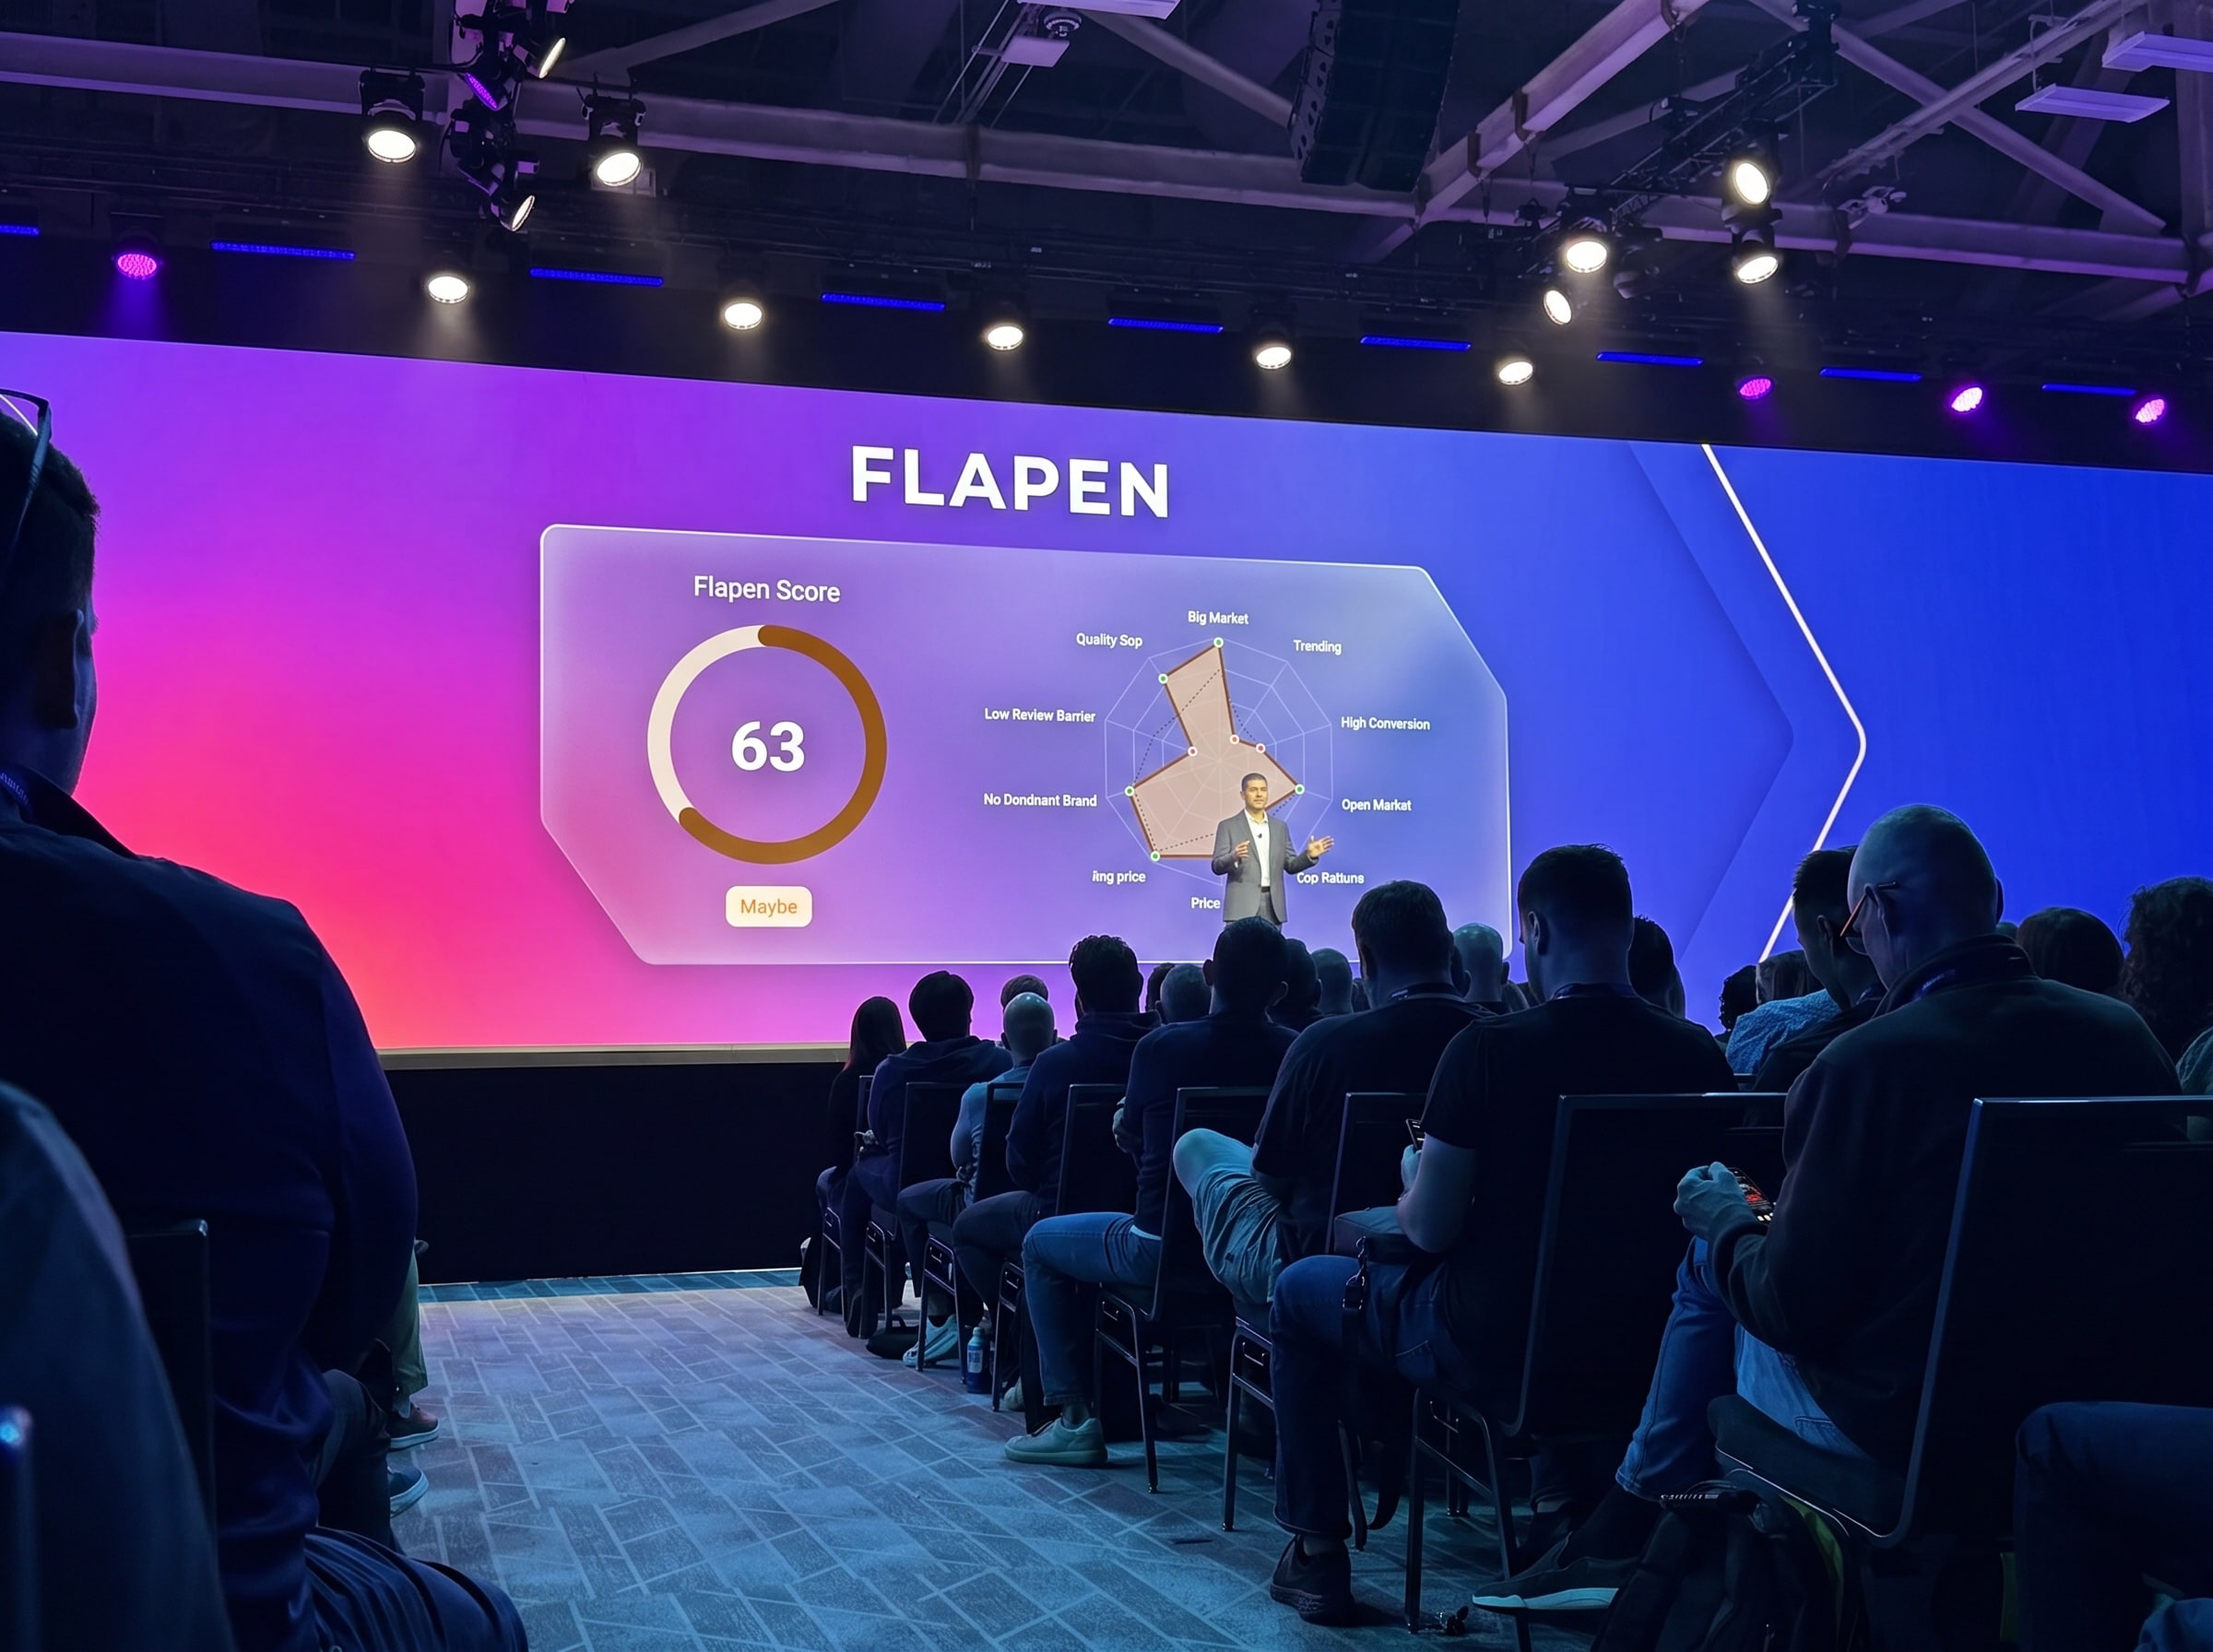
This is the real score card from the niche research, on live data. You get the same card for any niche we track. Read it in four steps.
- 01
Start at the big number. That is the Flapen Score out of 100, with its verdict next to it: Pass, Maybe, or Fail.
- 02
Read the line under it. It compares this niche with the others in its category. So you know whether the number is high or low for its neighborhood.
- 03
Then look at the shape. Each axis of the radar is one of the ten checks. The dashed line behind it is the category average. One glance shows where this niche is strong and where it trails.
- 04
Hover any axis label to see what it measures, or any dot for the real number behind the points.
Kids Guitar
MaybeShoppers spend an estimated $2.0M a year here. But demand is soft, at -7.6% this quarter, so Kids Guitar is a Maybe.
Flapen Score
Top 1% of 437 Musical Instruments niches · +19 vs the category median of 44
The dashed line is the average
Every category has its own normal. A big market in Pet Supplies is a small one in Toys and Games. So the radar always shows two shapes. The solid one is the niche you are looking at. The dashed one is the average of the niches in its category. Where the solid shape reaches past the dashed line, this niche is stronger than what is normal here. Where it stays inside, it trails. You can read a category you have never seen before in one look.
The Flapen Radar
Two niches can score the same and look nothing alike
The Flapen Score tells you how good a niche is. The Flapen Radar tells you what kind of good: strong axes are the opportunity, weak axes are the plan. Weakness on the entry side can be worked through with patience and inventory. Weakness on the demand side cannot. No amount of seller skill creates buyers.
A big market behind a wall
Flapen Score 62
An open door to a small room
Flapen Score 62
Illustrative shapes, drawn to land on the same score. Open any real niche in the research to see its own.
The verdict
What to do with the number
Ten checks produce one number, and the number produces one of three verdicts. The bar is set against everything we track, so a Pass means the top 4.8% of all niches. The typical niche scores 48. Even a niche that beats nine out of ten others sits at 61, still short of the line.
65+
Shortlist it. The market cleared the bar. Open the report and validate the rest: the products, the reviews, the price you can win at. From here the risk is your product and your plan, not the market.
50–64
The common case. Read the radar for what holds it at Maybe. Weakness on the entry side is a patience-and-inventory plan. Weakness on the demand side is a reason to walk. The live example above is a Maybe for exactly this reason.
Below 50
Skip without guilt. The score exists to remove niches from your week, and a Fail is it working. Spend the attention on the short list instead.
A research tool that finds an opportunity everywhere you look is not measuring opportunity. It is measuring your willingness to keep scrolling. The value of this score is in the 184,000 niches it removes from your week.
Calibration
Where we were wrong, and what this cannot tell you
We built the first version of these thresholds from an internal spreadsheet. Then we tested it against 15,742 real niches and found out how wrong it was. We would rather publish the corrections than have you find them, along with the things the score still cannot do.
What we corrected
Our size thresholds were off by an order of magnitude
The sheet said a market needed $1M a year in sales to rate as merely acceptable. Across the niches we track that is the 92nd percentile. The threshold graded about 90% of real niches as bad. We rebanded every size check to the actual distribution.
Our review thresholds described products that barely exist
The sheet called 100 reviews an exceptional opportunity. The median product we track has 287 reviews, so 100 sits at the 32nd percentile. The old rating bar would have graded 46% of real products as bad quality.
We threw one-year growth out of the score completely
It is the number every tool shows, and in the raw feed its semantics do not hold up. The median reads as +184% growth, and near-zero-base artifacts run absurdly high. The score uses the 90-day window instead, which behaves like a real distribution.
What it cannot tell you
It does not price your product.
Profit margin needs your cost of goods, your freight, and your ad spend. The score measures the market, not your P&L.
Its thresholds are calibrated on US data and applied everywhere.
The German market really is different, so German niches currently grade slightly harsh on size and slightly kind on returns. Per-marketplace thresholds are the next calibration, not a thing we have done.
A passing score is a starting line.
It says the market is worth entering. It does not say your product, your supplier, or your traffic plan will work. That part is operating, and operating is the harder half.
Results
What the sellers say









The method
The score is one part of a bigger system
The method the number plugs into, and the story of how it was built.