Methodik
Die Wissenschaft hinter unseren Nischen-Scores
Eine Nische ist eine Gruppe von Amazon-Produkten, die um dieselben Käufer konkurrieren. Der Flapen Score bewertet jede Nische, die wir erfassen, von 0 bis 100. Er beantwortet genau eine Frage: wie gut dieser Markt für einen neuen Verkäufer ist. Die meisten Recherche-Tools sind darauf ausgelegt, etwas für Sie zu finden. Unseres ist darauf ausgelegt, auszusortieren. Diese Seite zeigt, wie die Zahl entsteht, wie man sie liest und was man mit ihr macht.
- Bewertete Nischen
- 193.753
- Pass-Quote
- 4,8 %
Die Daten
Woher die Daten kommen
Ein Score ist nur so gut wie seine Daten. Wir lesen rund um die Uhr die öffentlichen Amazon-Seiten, die jeder Käufer sehen kann, und berechnen die Statistiken zweimal pro Stunde neu. Verkaufs- und Conversion-Zahlen sind Schätzungen, die aus diesen Seiten modelliert werden. Amazon veröffentlicht sie nicht, und wir erhalten sie nicht. Jeder Schwellenwert auf dieser Seite wurde an aktiven Nischen kalibriert. Nicht an Meinungen und nicht an einer Tabelle, die jemand einmal erstellt und nie geprüft hat.
Der Flapen Score
Zehn Kriterien, eine Zahl
Jedes Kriterium beantwortet einen Teil derselben Frage. Die Frage lautet, ob ein neuer Verkäufer in einem wachsenden Markt profitabel Anteile gewinnen kann. Zehn gewichtete Kriterien summieren sich zu einem Score von maximal 100. Sie gehören zu fünf Gruppen: Nachfrage, Wettbewerb, Markteintritt, Preis und Risiko. Bei den Marken, die wir geprüft und geführt haben, hätte der Score allein neun von zehn Fehlschlägen angezeigt.
Nachfrage
40 Punkte
Big Market
15 PunkteHow much shoppers spend on these products in a year. A big market means a winning product can earn a lot, which makes the risk worth taking.
Trending
15 PunkteHow much searches have grown in the last three months. A growing market keeps creating openings for new sellers.
High Conversion
10 PunkteHow often a search turns into a sale. When buyers buy fast, you spend less on ads to win each sale.
Wettbewerb
25 Punkte
Open Market
15 PunkteThe share of clicks going to the five most popular products. When no product dominates, it's easier to capture your share of the market.
No Dominant Brand
10 PunkteThe share of clicks going to the five biggest brands. When shoppers aren't attached to one brand, a new brand can enter.
Markteintritt
15 Punkte
Quality Gap
10 PunkteThe average star rating of the products already selling here. Read the negative reviews to see what to fix, and aim for a product 0.2 stars above the niche average.
Low Review Barrier
5 PunkteHow many reviews the average product here has. Plan to match that count before you sell at real volume.
Preis
10 Punkte
Avg price
5 PunkteWhat products here typically sell for. Between $15 and $100 there's usually enough room to make money after fees.
Price range
5 PunkteThe spread between the cheapest and priciest products here. When shoppers already pay a range of prices, there's room to position your own, including a premium version at the top.
Risiko
10 Punkte
Low Returns
10 PunkteHow often orders get returned. Every return costs you money, so a niche with rare returns protects your profit.
Der Preis ist die Ausnahme. Alle anderen Kriterien steigen. Der Preis erreicht seinen Höchstwert zwischen 15 $ und 100 $ und fällt zu beiden Seiten ab. Unterhalb des Fensters fressen die Gebühren die Marge. Oberhalb lassen Impulskäufe nach, und das pro Einheit gebundene Kapital wächst. Beide Preiskriterien sind bei 95 statt 100 gedeckelt, denn ein guter Preis ist Grundvoraussetzung, kein Vorteil.
Acht der zehn Kriterien vergeben ihre Punkte nach denselben Schwellenwerten, die auch die Rohzahl einstufen. So stehen das Badge neben einer Zahl und die Punkte, die sie bringt, nie im Widerspruch.
Eine echte Nische, bewertet
So lesen Sie die Karte
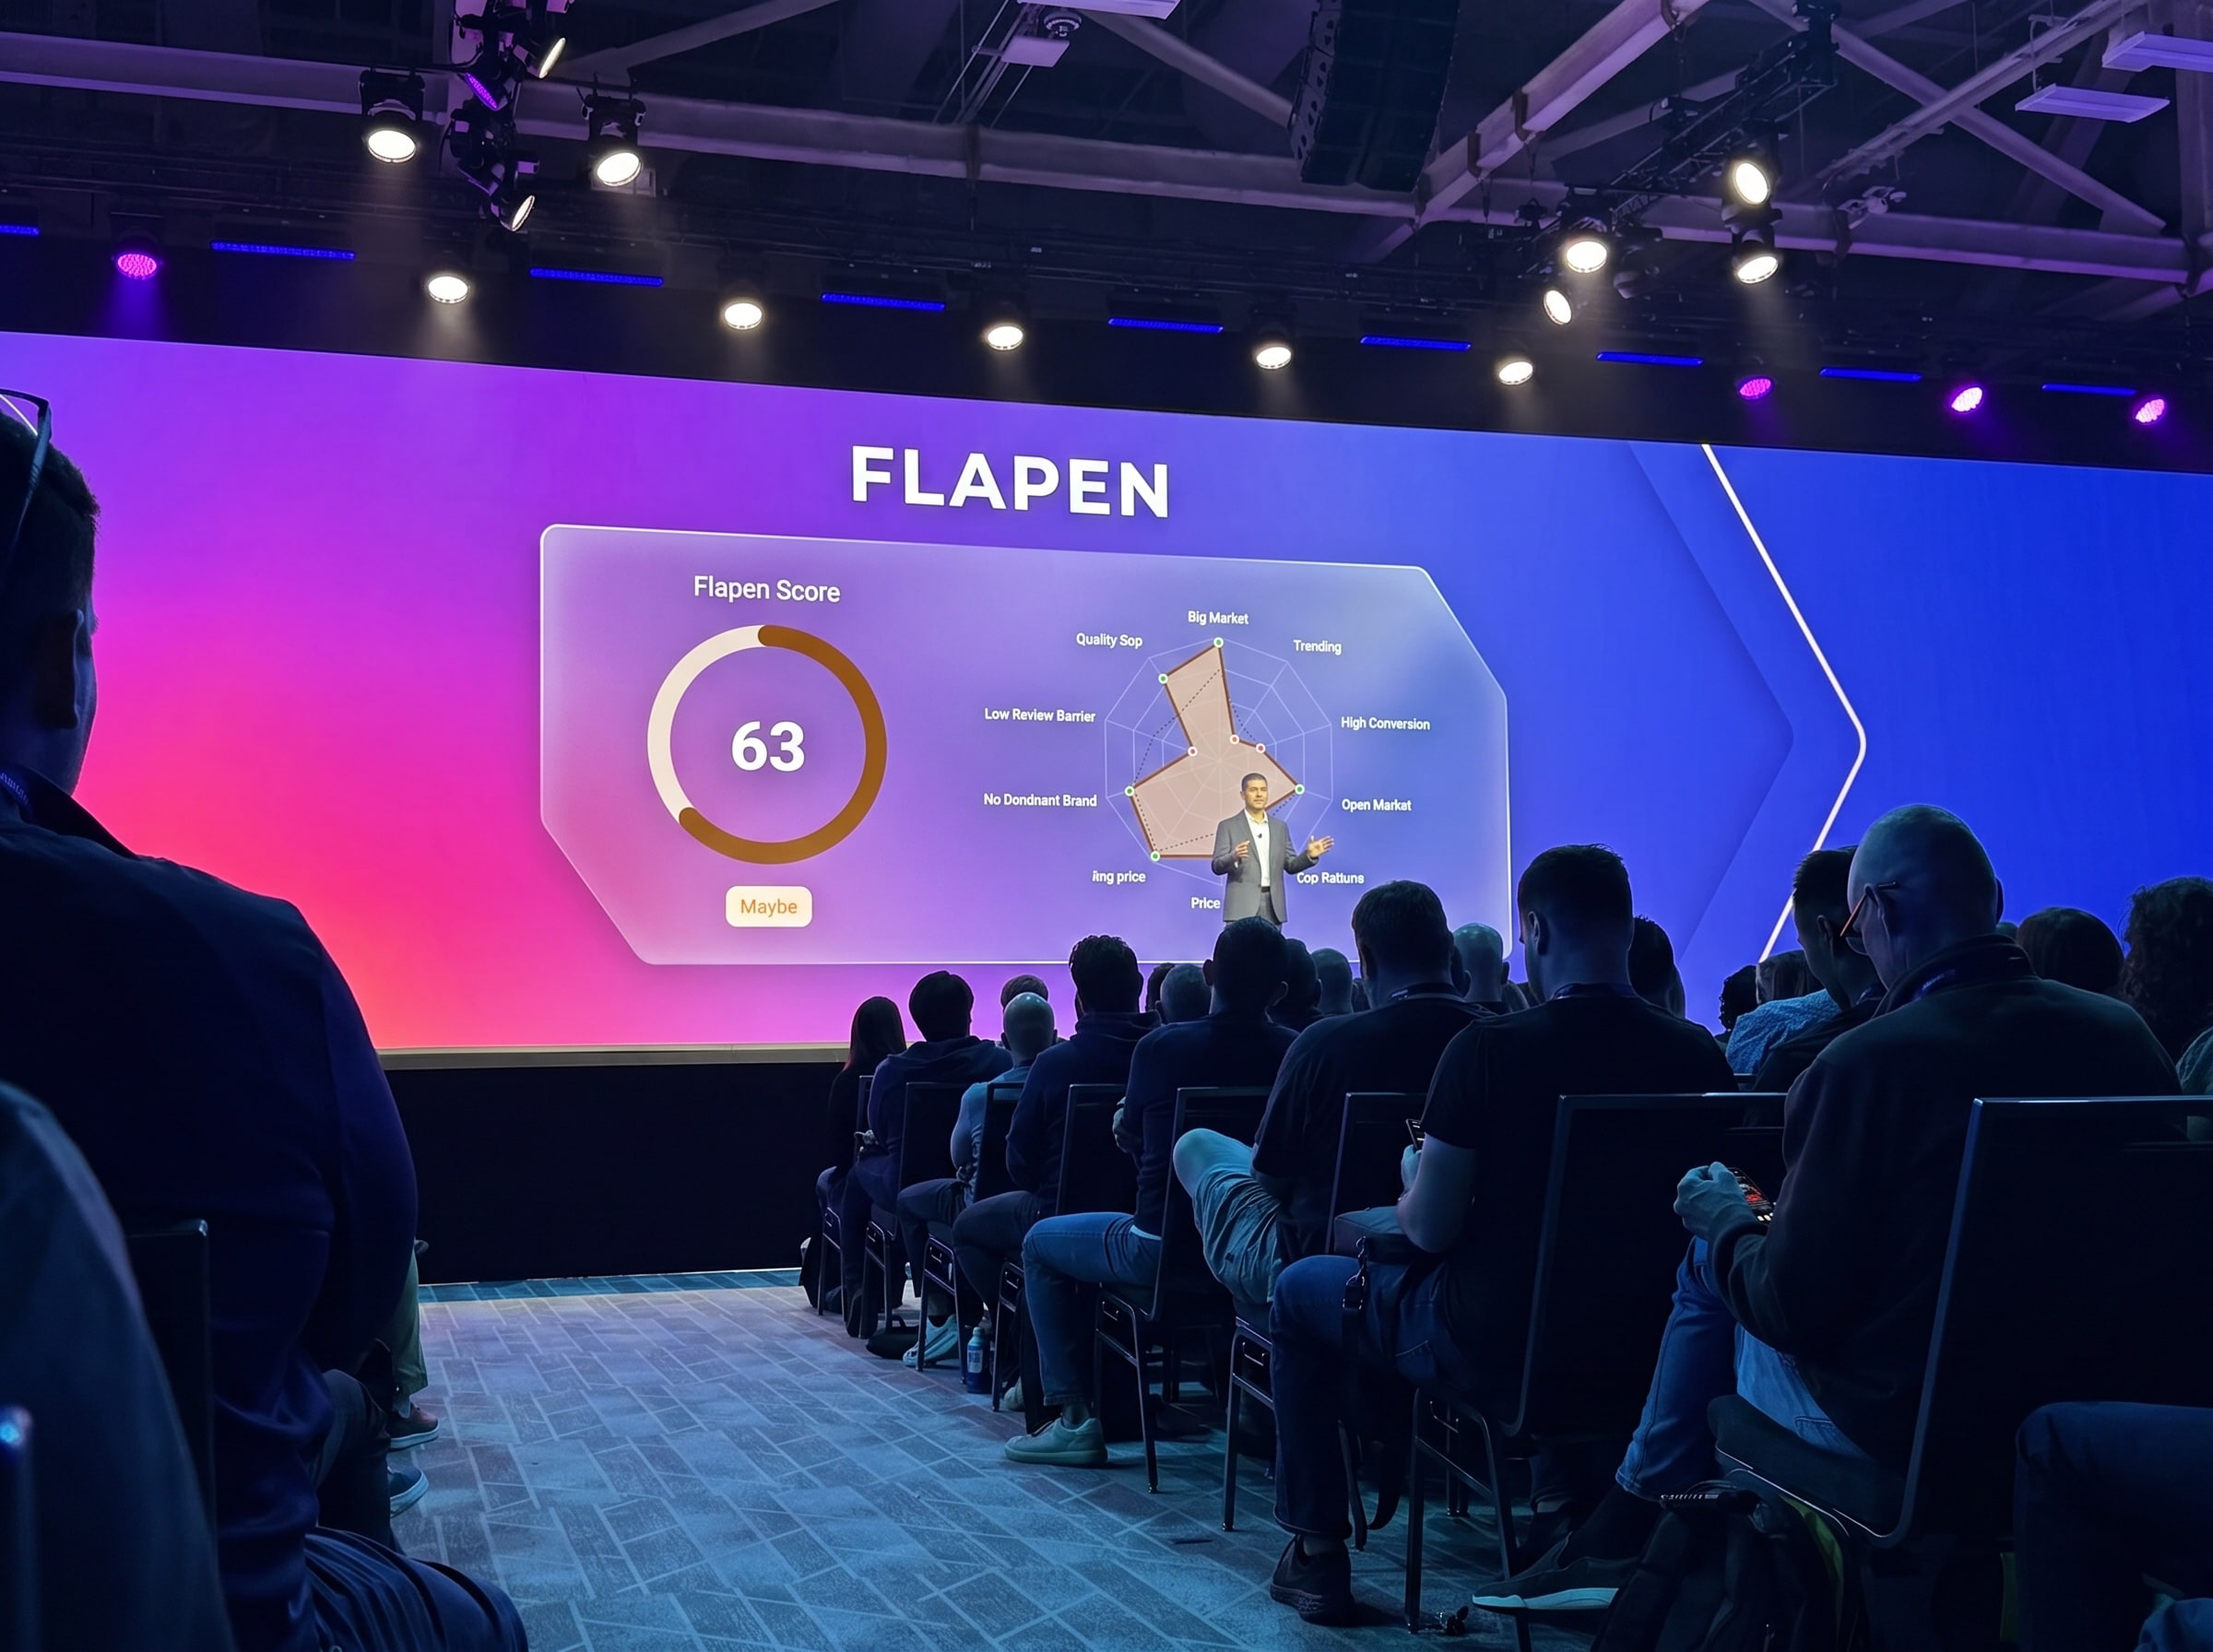
Das ist die echte Score-Karte aus der Nischen-Recherche, mit Live-Daten. Dieselbe Karte erhalten Sie für jede Nische, die wir erfassen. Lesen Sie sie in vier Schritten.
- 01
Beginnen Sie mit der großen Zahl. Das ist der Flapen Score von maximal 100, daneben steht sein Urteil: Pass, Maybe oder Fail.
- 02
Lesen Sie die Zeile darunter. Sie vergleicht diese Nische mit den anderen in ihrer Kategorie. So wissen Sie, ob die Zahl für ihr Umfeld hoch oder niedrig ist.
- 03
Sehen Sie sich dann die Form an. Jede Achse des Radars ist eines der zehn Kriterien. Die gestrichelte Linie dahinter ist der Kategoriedurchschnitt. Ein Blick zeigt, wo diese Nische stark ist und wo sie zurückliegt.
- 04
Fahren Sie mit der Maus über eine Achsenbeschriftung, um zu sehen, was sie misst, oder über einen Punkt, um die echte Zahl dahinter zu sehen.
Kids Guitar
MaybeShoppers spend an estimated $2.0M a year here. But demand is soft, at -7.6% this quarter, so Kids Guitar is a Maybe.
Flapen Score
Top 1% of 437 Musical Instruments niches · +19 vs the category median of 44
Die gestrichelte Linie ist der Durchschnitt
Jede Kategorie hat ihr eigenes Normalmaß. Ein großer Markt bei Haustierbedarf ist ein kleiner bei Spielzeug. Deshalb zeigt das Radar immer zwei Formen. Die durchgezogene ist die Nische, die Sie gerade ansehen. Die gestrichelte ist der Durchschnitt der Nischen in ihrer Kategorie. Wo die durchgezogene Form über die gestrichelte Linie hinausreicht, ist diese Nische stärker als hier üblich. Wo sie innerhalb bleibt, liegt sie zurück. So lesen Sie eine Kategorie, die Sie noch nie gesehen haben, auf einen Blick.
Das Flapen Radar
Zwei Nischen können denselben Score haben und völlig verschieden aussehen
Der Flapen Score sagt Ihnen, wie gut eine Nische ist. Das Flapen Radar sagt Ihnen, worin sie gut ist: Starke Achsen sind die Chance, schwache Achsen sind der Plan. Schwäche beim Markteintritt lässt sich mit Geduld und Lagerbestand überwinden. Schwäche bei der Nachfrage nicht. Kein Verkäufergeschick der Welt erschafft Käufer.
Ein großer Markt hinter einer Mauer
Flapen Score 62
Eine offene Tür zu einem kleinen Raum
Flapen Score 62
Beispielhafte Formen, so gezeichnet, dass sie denselben Score ergeben. Öffnen Sie eine echte Nische in der Recherche, um ihre eigene Form zu sehen.
Das Urteil
Was Sie mit der Zahl tun
Zehn Kriterien ergeben eine Zahl, und die Zahl ergibt eines von drei Urteilen. Die Messlatte richtet sich nach allem, was wir erfassen, ein Pass steht also für die besten 4,8 % aller Nischen. Die typische Nische erreicht 48. Selbst eine Nische, die neun von zehn anderen schlägt, liegt bei 61 und damit noch unter der Messlatte.
65+
Setzen Sie sie auf die Shortlist. Der Markt hat die Messlatte übersprungen. Öffnen Sie den Report und prüfen Sie den Rest: die Produkte, die Rezensionen, den Preis, zu dem Sie gewinnen können. Ab hier liegt das Risiko bei Ihrem Produkt und Ihrem Plan, nicht beim Markt.
50–64
Ein häufiger Fall. Lesen Sie am Radar ab, was die Nische bei Maybe hält. Schwäche beim Markteintritt ist ein Plan aus Geduld und Lagerbestand. Schwäche bei der Nachfrage ist ein Grund zu gehen. Das Live-Beispiel oben ist genau aus diesem Grund ein Maybe.
Unter 50
Lassen Sie sie ohne schlechtes Gewissen aus. Der Score ist dazu da, Nischen aus Ihrer Woche zu streichen, und ein Fail zeigt, dass er funktioniert. Widmen Sie Ihre Aufmerksamkeit stattdessen der Shortlist.
Ein Recherche-Tool, das überall eine Chance findet, wohin Sie auch schauen, misst keine Chance. Es misst Ihre Bereitschaft, weiterzuscrollen. Der Wert dieses Scores liegt in den 184.000 Nischen, die er aus Ihrer Woche streicht.
Kalibrierung
Wo wir falsch lagen und was der Score Ihnen nicht sagen kann
Die erste Version dieser Schwellenwerte haben wir aus einer internen Tabelle abgeleitet. Dann haben wir sie an 15.742 echten Nischen getestet und gesehen, wie falsch sie war. Wir veröffentlichen die Korrekturen lieber selbst, als dass Sie darauf stoßen, zusammen mit dem, was der Score noch immer nicht kann.
Was wir korrigiert haben
Unsere Größen-Schwellenwerte lagen um eine Größenordnung daneben
Laut Tabelle brauchte ein Markt 1 Million Dollar Umsatz pro Jahr, um auch nur als akzeptabel zu gelten. Unter den Nischen, die wir erfassen, entspricht das dem 92. Perzentil. Der Schwellenwert stufte rund 90 % der echten Nischen als schlecht ein. Wir haben jedes Größenkriterium an die tatsächliche Verteilung angepasst.
Unsere Rezensions-Schwellenwerte beschrieben Produkte, die es kaum gibt
Die Tabelle nannte 100 Rezensionen eine außergewöhnliche Chance. Im Median hat ein Produkt, das wir erfassen, 287 Rezensionen, 100 liegt also beim 32. Perzentil. Die alte Messlatte für die Bewertung hätte 46 % der echten Produkte als qualitativ schlecht eingestuft.
Das Einjahreswachstum haben wir komplett aus dem Score gestrichen
Es ist die Zahl, die jedes Tool zeigt, und im Rohdaten-Feed hält ihre Aussage keiner Prüfung stand. Der Median weist +184 % Wachstum aus, und Artefakte mit einer Basis nahe null schießen absurd hoch. Der Score nutzt stattdessen das 90-Tage-Fenster, das sich wie eine echte Verteilung verhält.
Was er Ihnen nicht sagen kann
Er kalkuliert Ihr Produkt nicht.
Die Gewinnmarge hängt von Ihren Warenkosten, Ihrer Fracht und Ihren Werbeausgaben ab. Der Score misst den Markt, nicht Ihre Gewinn- und Verlustrechnung.
Seine Schwellenwerte sind an US-Daten kalibriert und gelten überall.
Der deutsche Markt ist wirklich anders, deshalb werden deutsche Nischen derzeit bei der Größe etwas zu streng und bei den Retouren etwas zu mild bewertet. Schwellenwerte je Marktplatz sind die nächste Kalibrierung, nicht etwas, das wir schon erledigt haben.
Ein Pass ist eine Startlinie.
Er sagt, dass sich der Einstieg in den Markt lohnt. Er sagt nicht, dass Ihr Produkt, Ihr Lieferant oder Ihr Traffic-Plan funktioniert. Dieser Teil ist das operative Geschäft, und das operative Geschäft ist die schwierigere Hälfte.
Ergebnisse
Was die Verkäufer sagen









Die Methode
Der Score ist Teil eines größeren Systems
Die Methode, in die die Zahl einfließt, und die Geschichte ihrer Entstehung.