powerball
Skip itBrand-locked demand (top 5 brands take 96% of clicks) — this niche doesn't clear our bar today.
Avg price
Incredible$44.59avg listing price — sweet spot $15–$100
Quality gap
Great4.3★avg incumbent rating — lower means beatable quality
Price range
Good$15.78–$141.82cheapest to priciest tracked listing — scored on the share inside $15–$100
Review moat
Good1,415.1avg incumbent reviews — the moat a new listing must climb
Growth
Okay+15.8%90-day search growth — must beat 0% to launch
Conversion
Bad1.8%search→purchase rate — share of searches ending in a sale
Returns
Bad7.9%return rate — above 6% kills the launch gate
Competition
Bad82%top-5 click share — a locked-up shelf
Market size
Bad$54K$54K/yr · 67K searches
Brand share
Bad96%top-5 brand share — brand-locked demand
Competition
The top 5 products capture 82% of clicks — a locked-up shelf that new listings rarely crack.Brands
7 falling
Sellers
40
Top-5 brand share
96%
Open market
4%
- NSD63%
- Powerball12%
- Bala8%
- NSD Power7%
- GOZATO4%
- DFX4%
- Open — no brand owns it (1 brand, 4%)
Product shelf
Each bubble is one product — market share against review moat; bubble size tracks estimated sales, color grades how beatable the incumbent looks.
All 10 tracked products in this niche — three views at once, no toggling.
Top sellers
by 90-day click share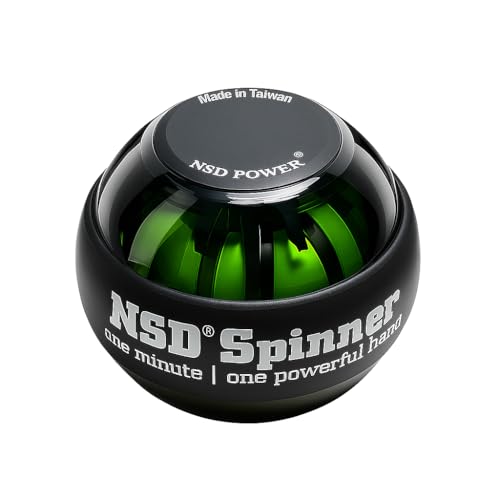
Auto-Start NSD Spinner Gyro Ball Up to 15 000 RPM Premium hand strengthener and wrist exerciser for grip strength training forearm workout and pain relief; durable and portable
NSD$45.144.3★732 rev

NSD Powerball 280Hz Autostart Classic
Powerball$63.024.2★2,318 rev
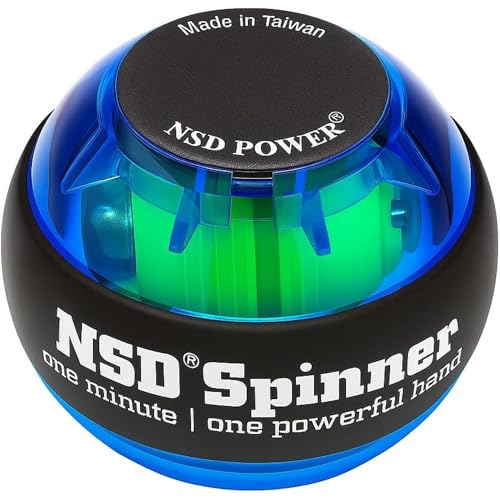
NSD Essential Crystal Spinner Gyro Ball | Grip Strengthener for Forearms Wrist & Hands | String Start Design Up to 18 000 RPM | Portable Wrist Trainer & Workout Equipment | Ideal for Desk Workers Athletes & Musicians
NSD$30.184.2★2,081 rev
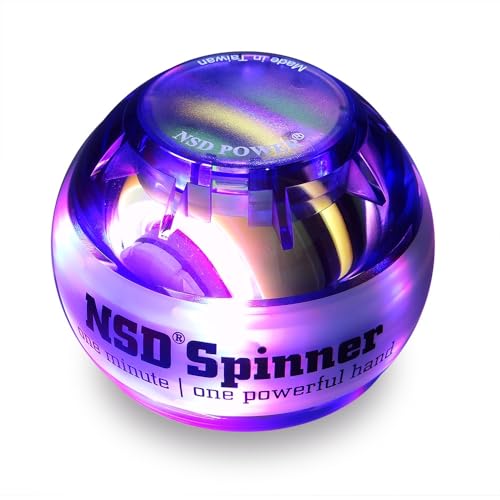
Auto-Start NSD Rainbow Lit Spinner Gyro Ball Up to 15 000 RPM Premium hand strengthener and wrist exerciser for grip strength training forearm workout and pain relief; durable and portable
NSD Power$56.274.1★353 rev
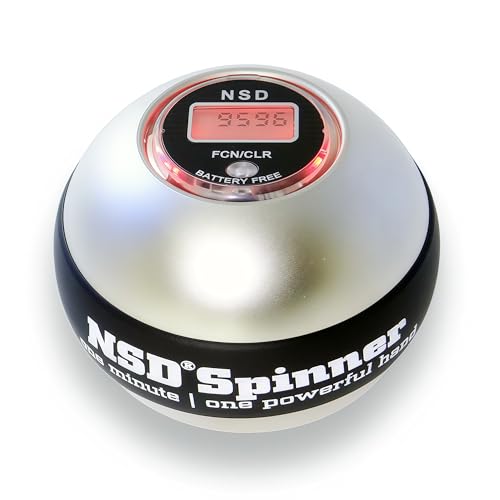
NSD Metallic Titan Pro Spinner Gyro Ball XL Grip Strengthener for Forearm Wrist & Hand Thumb Wind Start Up to 15 000 RPM Mobile Wrist Trainer & Workout Equipment Desk Workers & Athletes
NSD$141.825.0★2 rev
Newest
by launch date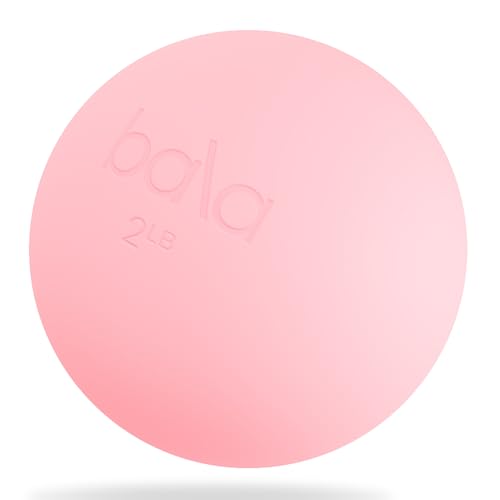
Bala Power Ball Weighted Toning Exercise Ball for Pilates Yoga Home Fitness & More - Workout Ball for Strength & Core Training Aerobics & Working Out to Improve Balance & Sculpt - 2lb Blush
Bala$24.9748 rev
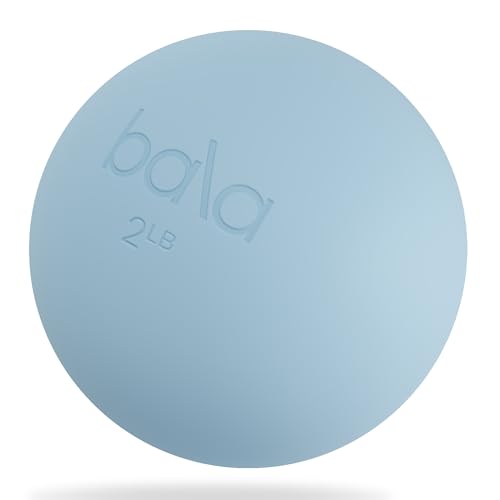
Bala Power Ball Weighted Toning Exercise Ball for Pilates Yoga Home Fitness & More - Workout Ball for Strength & Core Training Aerobics & Working Out to Improve Balance & Sculpt - 2lb Sea
Bala$24.8248 rev
NSD Metallic Titan Pro Spinner Gyro Ball XL Grip Strengthener for Forearm Wrist & Hand Thumb Wind Start Up to 15 000 RPM Mobile Wrist Trainer & Workout Equipment Desk Workers & Athletes
NSD$141.822 rev
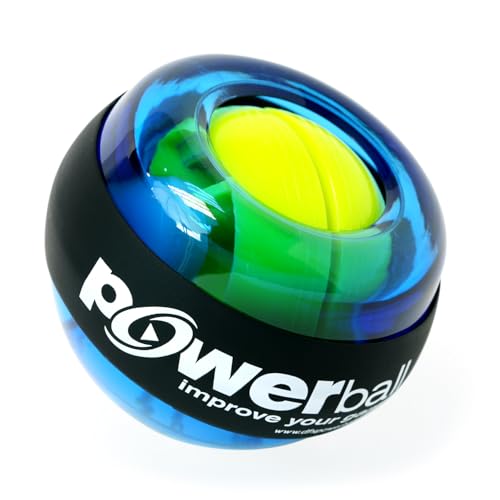
DFX Powerball Sports Pro Beginner-Friendly Gyroscopic Hand & Wrist Trainer for Grip Strength Forearm Exercise and Rehabilitation Up to 35 lbs Resistance Includes Starter Cord
DFX$27.563 rev
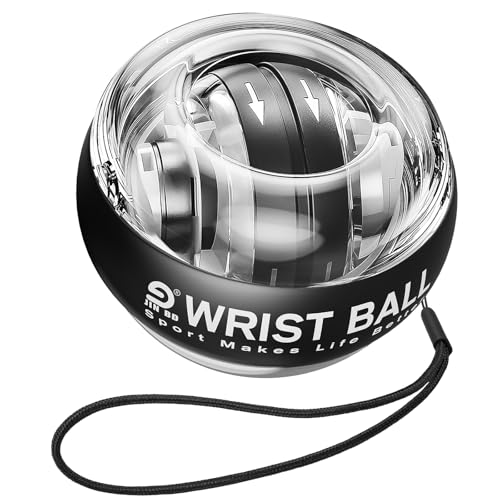
JIN BD Wrist Trainer Ball Auto-Start Gyroscopic Forearm Exerciser Gyro Ball for Strengthen Arms Fingers Grip and Muscles Black No Light
JIN BD$15.785,344 rev
Trending
90-day click momentumBala Power Ball Weighted Toning Exercise Ball for Pilates Yoga Home Fitness & More - Workout Ball for Strength & Core Training Aerobics & Working Out to Improve Balance & Sculpt - 2lb Blush
Bala$24.974.6★
Bala Power Ball Weighted Toning Exercise Ball for Pilates Yoga Home Fitness & More - Workout Ball for Strength & Core Training Aerobics & Working Out to Improve Balance & Sculpt - 2lb Sea
Bala$24.824.6★
NSD Metallic Titan Pro Spinner Gyro Ball XL Grip Strengthener for Forearm Wrist & Hand Thumb Wind Start Up to 15 000 RPM Mobile Wrist Trainer & Workout Equipment Desk Workers & Athletes
NSD$141.825.0★
Auto-Start NSD Spinner Gyro Ball Up to 15 000 RPM Premium hand strengthener and wrist exerciser for grip strength training forearm workout and pain relief; durable and portable
NSD$45.144.3★
NSD Essential Crystal Spinner Gyro Ball | Grip Strengthener for Forearms Wrist & Hands | String Start Design Up to 18 000 RPM | Portable Wrist Trainer & Workout Equipment | Ideal for Desk Workers Athletes & Musicians
NSD$30.184.2★
Demand & seasonality
Weekly Amazon search volume, last 98 weeks — +15.8% search growth over the last 90 days.Peak months: Jul, Aug, Sep, Oct, Nov · busiest ÷ quietest = 3.5×
Reviews
What buyers praise and complain about, mined from review topics.What buyers love
“Good quality”
“Works great”
“Easy to use”
“Item arrived as stated”
“GREAT Exercise Tool”
“It feels nicely balanced in your hands”
“Its better than the less expensive ball I bought for myself marketed under another brand name”
“great for forearm workouts”
“Exactly”
“Worth the Upgrade: Quiet, Smooth, and Easy to Start”
What buyers complain about
“Did not work”
“Hard to use”
“Instructions on using the device are unclear and not intuitive”
“Not well made”
“Overpriced”
“Lost strength and mobility”
“Its heavy and hard to grip with small hands”
“For the first 10 minutes I thought I broke it”
“The product was totally ineffective for exercising my wrist”
“does not work as advertised”