ddj 200
Skip it27/100a small market ($98K/yr) — ddj 200 doesn't clear our bar today.
Market/yr
$98K
Growth (1y)
+19.1%
Products
12
Brands
5
was 4 a year ago
Sellers
85
Price range
$83.64–$367.31
Returns
5.2%
Rating
4.5★
Skip it
Scored 27/100 across market size, growth, competition, quality gap, and returns.
Demand
Weekly Amazon search volume, last 104 weeks — +19.1% year over year.Seasonality
Monthly demand index across the year — 1.00 is average.Peak months: Mar, Dec · busiest ÷ quietest = 2.2×
Competition
- AlphaTheta51%
- Pioneer DJ24%
- Hercules10%
- PIONEER9%
- Numark6%
The top 5 products capture 79% of clicks — a locked-up shelf that new listings rarely crack. 5 brands and 85 sellers compete here.
Brands
5 rising
was 4 a year ago
Sellers
85
Top 5 brand share
100%

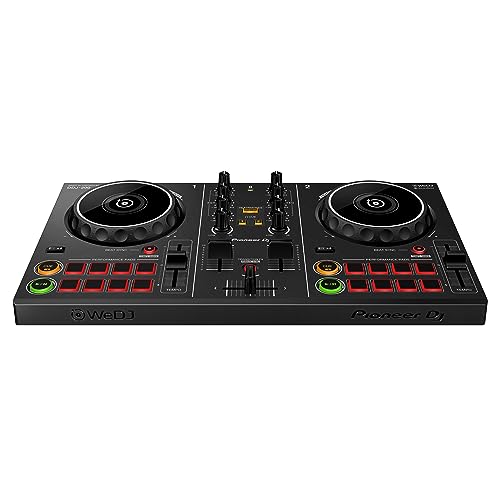
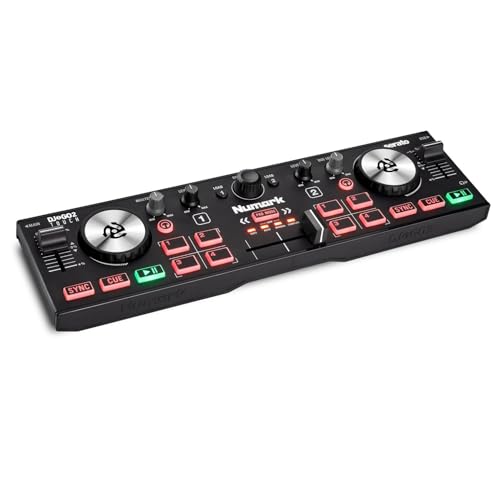
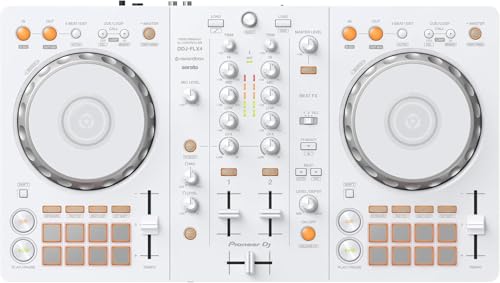
Product shelf
All 12 tracked products in this niche.

AlphaTheta DDJ-FLX2 Beginner DJ Controller for Phone Tablet & PC
AlphaTheta
$180.474.4★430 reviews
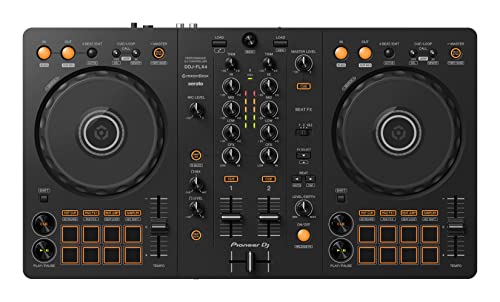
Pioneer DJ DDJ-FLX4 2-deck Rekordbox and Serato DJ Controller - Graphite
Pioneer DJ
$323.104.7★2,661 reviews
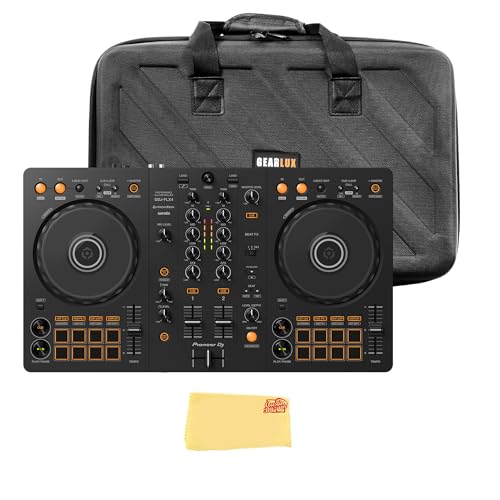
Pioneer DJ DDJ-FLX4 2-Channel DJ Controller - Black Bundle with Carrying Case and Austin Bazaar Polishing Cloth
PIONEER
$367.314.6★82 reviews
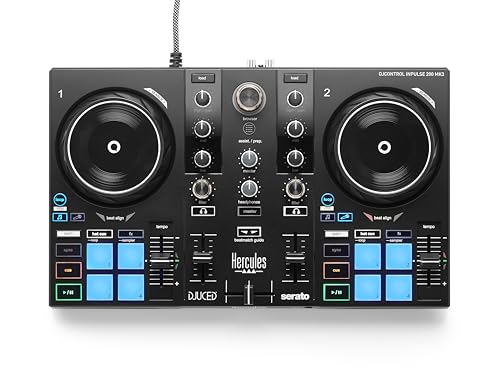
Hercules DJControl Inpulse 200 MK3 DJ Controller 2 Deck DJ Mixer with Jog Wheels Pads Crossfader Beginner DJ Equipment with Tutorials and Streaming Compact Portable DJ Board Compatible with PC
Hercules
$115.464.9★20 reviews
AlphaTheta/Pioneer DJ DDJ-FLX2 Beginner DJ Controller Portable USB-Powered 2-Channel Controller with Professional Layout Compatible with Music Streaming Services Perfect for New DJs
AlphaTheta
$181.154.4★418 reviews

Numark Party Mix II DJ Controller with Built-in Lights
Numark
$125.944.3★4,810 reviews
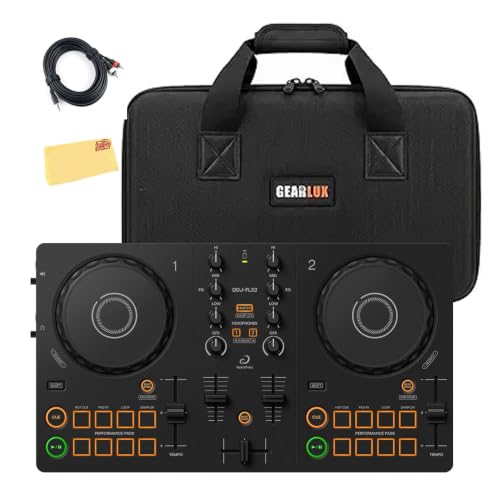
Pioneer DJ AlphaTheta DDJ-FLX2 Compact 2-Channel DJ Controller Bundle with Carrying Case TRS Cable and Austin Bazaar Polishing Cloth
AlphaTheta
$228.154.4★39 reviews

Pioneer DJ DDJ-REV1 2-deck Serato DJ Controller Black
Pioneer DJ
$283.074.5★974 reviews
Reviews
What buyers praise and complain about, mined from review topics.What buyers love
“solid build quality”
“Easy to use”
“Great product, especially for the price”
“Best portable controller I own”
“Well built and was compatible with no issues whatsoever with DJay Pro”
“Durable”
“Above and beyond expectations”
“Great Control for a good price”
“While its lightweight”
“I loved it because it's small”
What buyers complain about
“Doesn't work”
“Wont connect”
“Sound awful”
“Poor quality construction/build”
“something that would have been nice to see in the specifications”
“Smaller than expected”
“but didn't last long”
“Maybe a faulty item”
“There are worse ways to spend your money”
“got a used one”
Top return reasons
- Compatibility-Overall13%
- Functionality-Overall13%
- Size-Overall12%
- Value For Money12%
- Connectivity-Overall9%
- Audio Quality6%
- Advertised Vs Actual Product6%
- Touch/Button Controls6%
- Defective Material/Parts4%
- Ease Of Use3%