voltaren patch
Launch itA $2.1M/yr market growing +30.1% this quarter with returns at 0.1% — clears our launch bar.
Returns
Incredible0.1%return rate — above 6% kills the launch gate
Conversion
Incredible18.3%search→purchase rate — share of searches ending in a sale
Market size
Incredible$2.1M$2.1M/yr · 593K searches
Avg price
Great$19.82avg listing price — sweet spot $15–$100
Price range
Great$5.52–$46.91cheapest to priciest tracked listing — scored on the share inside $15–$100
Growth
Good+30.1%90-day search growth — must beat 0% to launch
Quality gap
Okay4.5★avg incumbent rating — lower means beatable quality
Review moat
Bad8,021.86avg incumbent reviews — the moat a new listing must climb
Competition
Bad92%top-5 click share — a locked-up shelf
Brand share
Bad100%top-5 brand share — brand-locked demand
Competition
The top 5 products capture 92% of clicks — a locked-up shelf that new listings rarely crack.Brands
3 falling
Sellers
91
Top-5 brand share
100%
Open market
0%
- Salonpas91%
- Amazon Basic Care6%
- Sumifun3%
- Open — no brand owns it (0%)
Product shelf
Each bubble is one product — market share against review moat; bubble size tracks estimated sales, color grades how beatable the incumbent looks.
All 7 tracked products in this niche — three views at once, no toggling.
Top sellers
by 90-day click share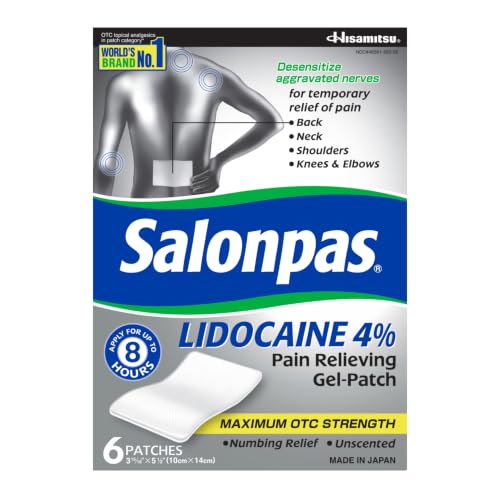
Salonpas Lidocaine 4% Pain Relieving Gel-Patch 6 Count for Back Neck Shoulder Knee & Elbow Pain
Salonpas$9.634.5★13,740 rev
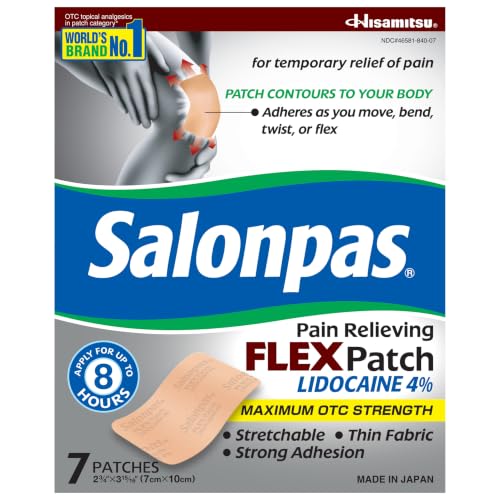
Salonpas Maximum OTC Strength Lidocaine 4% Pain Relieving Apply for Up to 8 Hours Unscented Thin Flexible Lightweight Stays in Place 7 Patches
Salonpas$12.844.4★4,935 rev
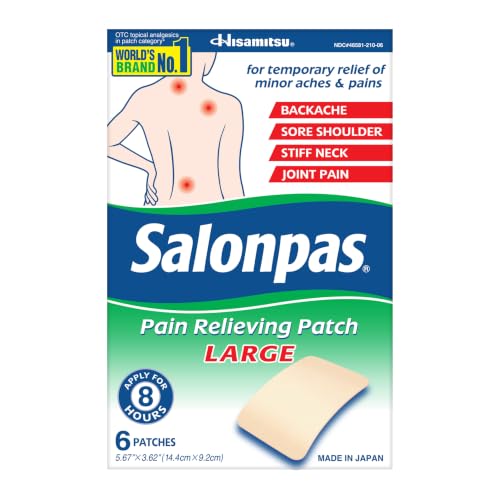
Salonpas Pain Relieving Patch Large 6 Count for Back Neck Shoulder Knee Pain and Muscle Soreness 8 Hour Pain Relief
Salonpas$5.524.6★19,478 rev
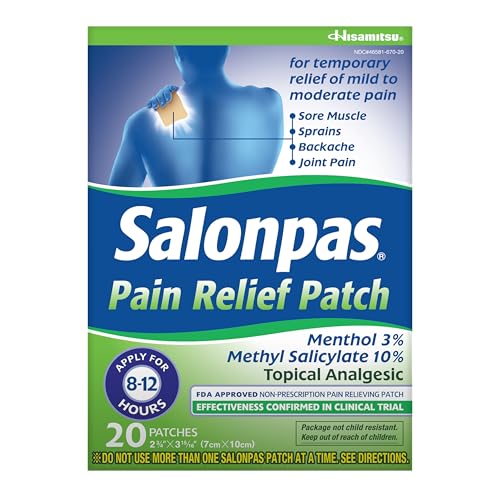
Salonpas Pain Relief Patch 20 Count (Pack of 1) Up to 12 Hours Temporary Relief of Mild to Moderate Pain Backache Sore Muscle Sprains Bruises
Salonpas$16.724.6★2,014 rev

Amazon Basic Care Maximum Strength OTC Pain Relief 4% Lidocaine Patch 3.9 x 5.5 15-Count Box (Previously HealthWise)
Amazon Basic Care$14.924.3★9,172 rev
Newest
by launch date
Sumifun 4% Lidocaine Pain Relief Patches 30 Count Maximum Strength Numbing Gel Patch for Back Knee Neck Joint Ache Muscle Soreness Topical Analgesic
Sumifun$32.185,116 rev
Amazon Basic Care Maximum Strength OTC Pain Relief 4% Lidocaine Patch 3.9 x 5.5 15-Count Box (Previously HealthWise)
Amazon Basic Care$14.929,172 rev
Salonpas Maximum OTC Strength Lidocaine 4% Pain Relieving Apply for Up to 8 Hours Unscented Thin Flexible Lightweight Stays in Place 7 Patches
Salonpas$12.844,935 rev
Salonpas Pain Relief Patch 20 Count (Pack of 1) Up to 12 Hours Temporary Relief of Mild to Moderate Pain Backache Sore Muscle Sprains Bruises
Salonpas$16.722,014 rev

Salonpas LIDOCAINE (5 Pack Bundle) Pain Relieving Maximum Strength Gel Patch!
Salonpas$46.911,698 rev
Trending
90-day click momentumAmazon Basic Care Maximum Strength OTC Pain Relief 4% Lidocaine Patch 3.9 x 5.5 15-Count Box (Previously HealthWise)
Amazon Basic Care$14.924.3★
Salonpas Pain Relief Patch 20 Count (Pack of 1) Up to 12 Hours Temporary Relief of Mild to Moderate Pain Backache Sore Muscle Sprains Bruises
Salonpas$16.724.6★
Salonpas Pain Relieving Patch Large 6 Count for Back Neck Shoulder Knee Pain and Muscle Soreness 8 Hour Pain Relief
Salonpas$5.524.6★
Salonpas Maximum OTC Strength Lidocaine 4% Pain Relieving Apply for Up to 8 Hours Unscented Thin Flexible Lightweight Stays in Place 7 Patches
Salonpas$12.844.4★
Salonpas LIDOCAINE (5 Pack Bundle) Pain Relieving Maximum Strength Gel Patch!
Salonpas$46.914.6★
Demand & seasonality
Weekly Amazon search volume, last 104 weeks — +30.1% search growth over the last 90 days.Peak months: May, Jun · busiest ÷ quietest = 1.9×
Reviews
What buyers praise and complain about, mined from review topics.What buyers love
“Does work”
“EXCELLENT PRODUCT”
“Knee pain relief”
“They are affordable”
“Good adhesive”
“ITEM AS DESCRIBED”
“Muscle Relief”
“EASE OF USE”
“They are cool upon application”
“fits”
What buyers complain about
“Adhesive is not very good”
“did not help pain”
“Not effective”
“To expensive”
“Strong odor”
“hard to open”
“Not good quality”
“dont last”
“Patches are smaller than I expected”
“Flimsy”