trolamine salicylate cream
Skip itA small market ($33K/yr) — this niche doesn't clear our bar today.
Returns
Incredible0.1%return rate — above 6% kills the launch gate
Conversion
Great8.8%search→purchase rate — share of searches ending in a sale
Avg price
Great$16.73avg listing price — sweet spot $15–$100
Price range
Great$6.14–$48.34cheapest to priciest tracked listing — scored on the share inside $15–$100
Growth
Okay+9.0%90-day search growth — must beat 0% to launch
Review moat
Okay3,188.7avg incumbent reviews — the moat a new listing must climb
Quality gap
Okay4.6★avg incumbent rating — lower means beatable quality
Brand share
Bad90%top-5 brand share — brand-locked demand
Competition
Bad83%top-5 click share — a locked-up shelf
Market size
Bad$33K$33K/yr · 22K searches
Competition
The top 5 products capture 83% of clicks — a locked-up shelf that new listings rarely crack.Brands
8 rising
Sellers
64
Top-5 brand share
90%
Open market
6%
- Aspercreme66%
- Generic9%
- Globe8%
- CareAll4%
- BLUE-EMU4%
- GoodSense3%
- Open — no brand owns it (2 brands, 6%)
Product shelf
Each bubble is one product — market share against review moat; bubble size tracks estimated sales, color grades how beatable the incumbent looks.
All 10 tracked products in this niche — three views at once, no toggling.
Top sellers
by 90-day click share
Aspercreme Original Pain Relief Cream for Arthritis Joint & Muscle Pain Non-Greasy Topical Analgesic with Moisturizing Aloe & Max-Strength 10% Trolamine Salicylate 3 oz.
Aspercreme$6.144.6★2,302 rev
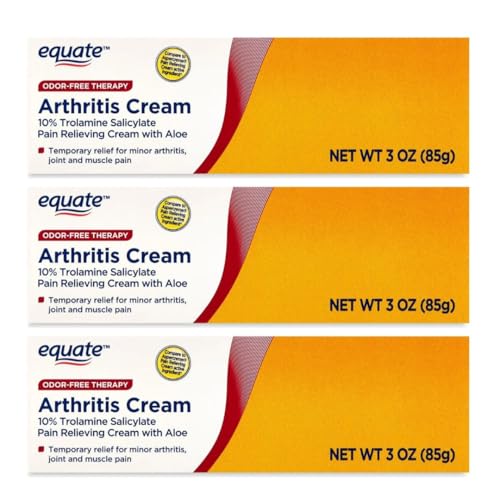
Equate Arthritis Cream 10% Trolamine Salicylate with Aloe 3 oz (3 Pack)
Generic$27.954.9★14 rev
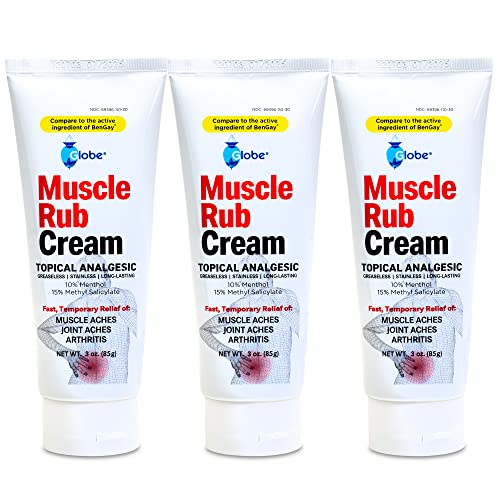
(3 Pack) Globe Ultra Strength Greaseless Muscle Rub Cream (3 oz). Compare to The Active Ingredients of Greaseless Bengay 10% Menthol & 15% Methyl Salicylate (3 Pack)
Globe$10.344.5★362 rev

CareAll Muscle & Joint Vanishing Scent Gel 3.0 oz. (3 Pack) Non-Greasy Pain Relief Gel for Muscle Back and Minor Arthritis Topical Analgesic 2.5% Menthol
CareAll$8.554.7★559 rev

BLUE-EMU Maximum Pain Relief Cream for Arthritis Muscle & Joint Aches 3 Oz 1 Pack
BLUE-EMU$13.884.3★5,864 rev
Newest
by launch date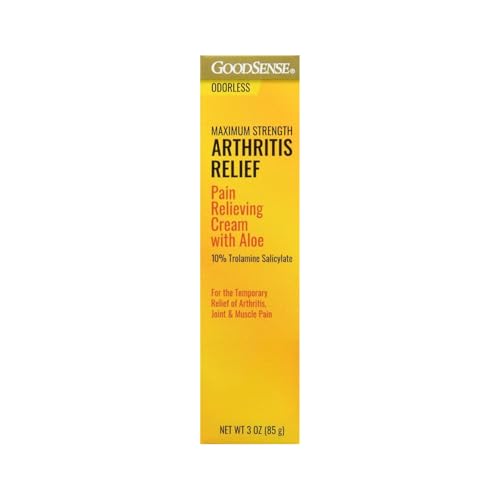
GoodSense Maximum Strength Pain Relief Cream Odorless 3 Oz (Pack of 3)
GoodSense$23.380 rev
Equate Arthritis Cream 10% Trolamine Salicylate with Aloe 3 oz (3 Pack)
Generic$27.9514 rev
(3 Pack) Globe Ultra Strength Greaseless Muscle Rub Cream (3 oz). Compare to The Active Ingredients of Greaseless Bengay 10% Menthol & 15% Methyl Salicylate (3 Pack)
Globe$10.34362 rev
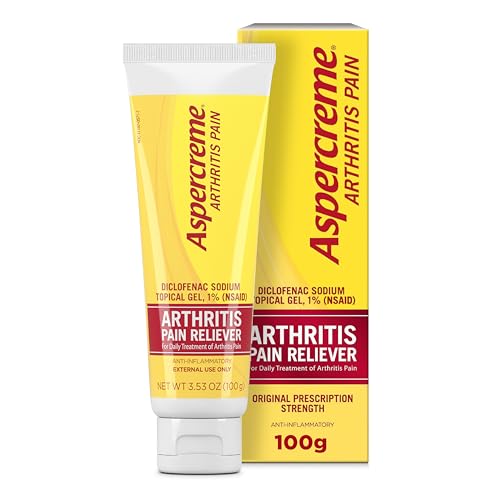
Aspercreme Arthritis Pain Relief Gel for Arthritis & Joint Pain Non-steroidal Anti-inflammatory Topical Gel with Max-Strength Diclofenac Sodium 100 g
Aspercreme$15.561,696 rev
Aspercreme Original Pain Relief Cream for Arthritis Joint & Muscle Pain Non-Greasy Topical Analgesic with Moisturizing Aloe & Max-Strength 10% Trolamine Salicylate 3 oz.
Aspercreme$6.142,302 rev
Trending
90-day click momentumGoodSense Maximum Strength Pain Relief Cream Odorless 3 Oz (Pack of 3)
GoodSense$23.380.0★
Equate Arthritis Cream 10% Trolamine Salicylate with Aloe 3 oz (3 Pack)
Generic$27.954.9★

Bengay Ultra Strength Topical Pain Relief Cream Non-Greasy Topical Analgesic for Minor Arthritis Muscle Joint and Back Pain Camphor Menthol and Methyl Salicylate 4 OZ
Bengay$6.704.7★
(3 Pack) Globe Ultra Strength Greaseless Muscle Rub Cream (3 oz). Compare to The Active Ingredients of Greaseless Bengay 10% Menthol & 15% Methyl Salicylate (3 Pack)
Globe$10.344.5★
Aspercreme Arthritis Pain Relief Gel for Arthritis & Joint Pain Non-steroidal Anti-inflammatory Topical Gel with Max-Strength Diclofenac Sodium 100 g
Aspercreme$15.564.5★
Demand & seasonality
Weekly Amazon search volume, last 79 weeks — +9.0% search growth over the last 90 days.Peak months: Jan, Sep · busiest ÷ quietest = 2.1×
Reviews
What buyers praise and complain about, mined from review topics.What buyers love
“I am amazed with the strong positive reviews”
“Works quickly”
“This cream works really well for sore muscles and joint pain”
“Relieves muscle pain”
“effective product with a strong aroma”
“Great Price”
“As described and pictured”
“Easy to use”
“Effective”
“absorbs quickly”
What buyers complain about
“The smell is too strong”
“Dont work at all”
“over priced”
“I wasted my money it didnt help with pain”
“No this didnt help my arthritis pain so I cant recommend it for that”
“the heat of the product caused a Fibromyalgia flare up”
“I hate taking medications because of side effects”
“I will not return these because they help with my muscle pain BUT the tubes are less than half full”
“does not reduce internal inflammation or support actual recovery from back pain or strain”
“The screw-top remains precarious”