tea tree oil for toenail fungus
Worth a lookShows low returns (0.6%), but a deep review moat (7,179 avg reviews) keeps it on the watch list.
Returns
Incredible0.6%return rate — above 6% kills the launch gate
Conversion
Great10.6%search→purchase rate — share of searches ending in a sale
Avg price
Good$13.70avg listing price — sweet spot $15–$100
Market size
Good$371K$371K/yr · 256K searches
Brand share
Good72%top-5 brand share — brands hold most of the demand
Price range
Good$6.54–$24.98cheapest to priciest tracked listing — scored on the share inside $15–$100
Quality gap
Okay4.5★avg incumbent rating — lower means beatable quality
Growth
Okay+9.3%90-day search growth — must beat 0% to launch
Competition
Okay66%top-5 click share — leaders hold, buyers still browse
Review moat
Bad7,179.21avg incumbent reviews — the moat a new listing must climb
Competition
The top 5 products take 66% of clicks — established leaders, but buyers still shop beyond them.Brands
13 falling
Sellers
38
Top-5 brand share
72%
Open market
21%
- Fiora Naturals31%
- FOOT CURE16%
- First Botany11%
- Purely Northwest8%
- DERMATOOL7%
- SU JUABA7%
Product shelf
Each bubble is one product — market share against review moat; bubble size tracks estimated sales, color grades how beatable the incumbent looks.
All 14 tracked products in this niche — three views at once, no toggling.
Top sellers
by 90-day click share
Tea Tree Oil 100% Pure Organic Tea Tree Essential Oil for Skin Face Hair Scalp Nails and Toenail 1 fl oz - By Fiora Naturals
Fiora Naturals$11.464.6★13,878 rev
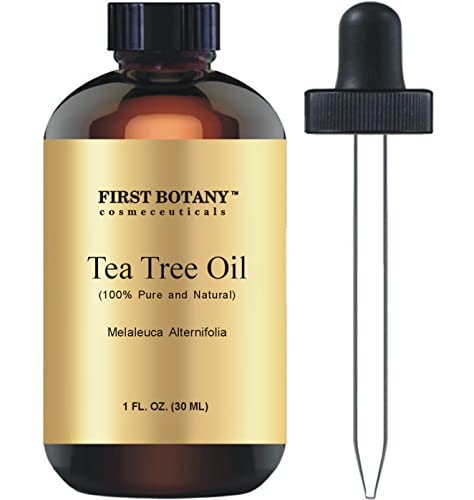
First Botany 100% Pure Australian Tea Tree Essential Oil with high conc. of Terpinen - A Known Solution to Help in Fighting Acne Toenail Issues Dandruff. (1 fl oz)
First Botany$9.134.5★10,187 rev
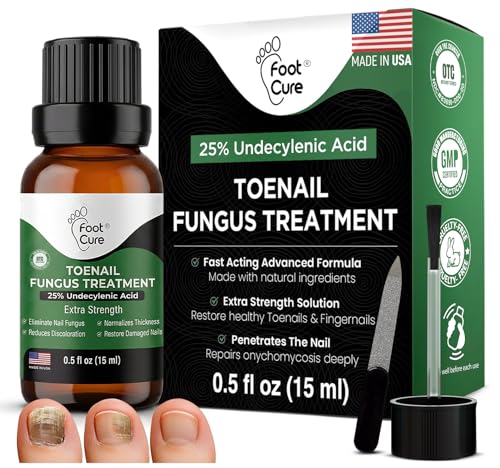
Foot Cure Toenail Fungus Treatment Extra Strength Athletes Foot Treatment for Toenails Restorative Nail Repair for Damaged Nails Toenail Softener with Tea Tree Oil & Oregano Oil - Made in USA
FOOT CURE$18.654.0★30,290 rev

Toenail Fungus Extra Strength Solution-Thick Discolored Nail Repair Ingrown Nails Dry Cracked Nails & Cuticles-All Natural with Tea Tree & Oregano Oil: by Purely Northwest USA 1oz
Purely Northwest$18.104.3★2,382 rev

Toenail Fungus Treatment Extra Strength Antifungal Solution and Nail Fungus Treatment for Toenail - Repairs Fungal Damaged Yellow Thick Discolored Nails - Fingernails and Toe Nail Fungus Treatments
DERMATOOL$24.984.1★5,588 rev
Newest
by launch date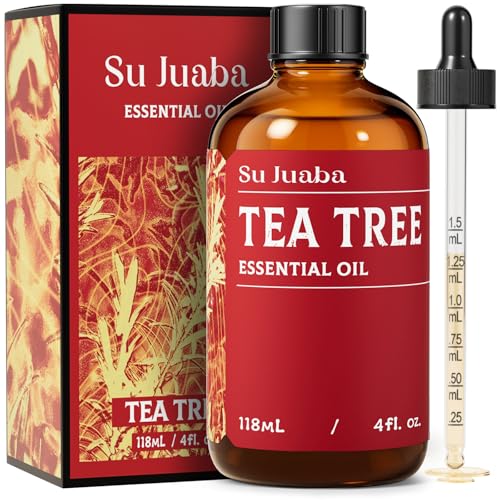
SU JUABA Tea Tree Oil Aromatherapy Oil
SU JUABA$8.40342 rev
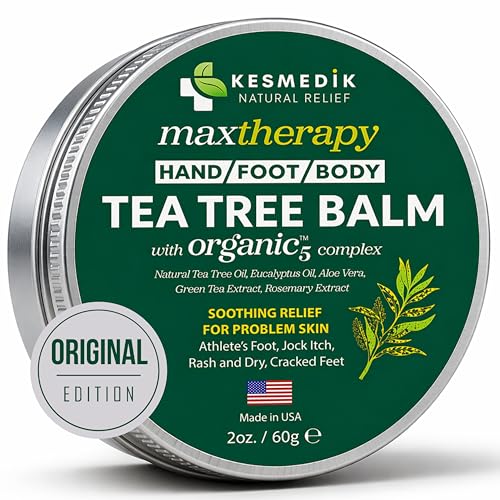
KESMEDIK Tea Tree Oil Balm for Skin Soothes Itching Rashes & Dry Skin Antifungal Defense for Athletes Foot Jock Itch Chafing Bug Bites & Eczema Natural Effective & Safe for All Ages
KESMEDIK$16.061,216 rev
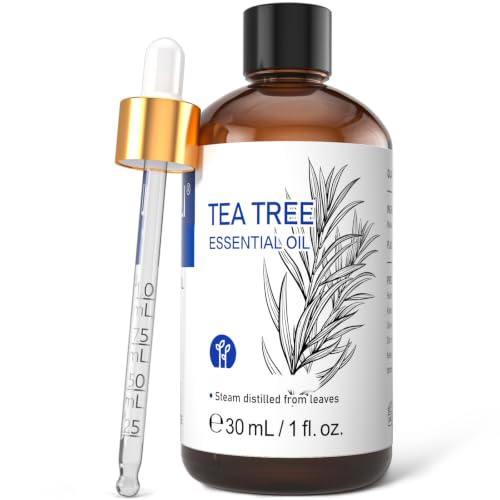
HIQILI Tea Tree Oil for Skin Hair Toenail
HIQILI$6.545,021 rev

GM Gumili Tea Tree Oil for Skin Hair Nails Face Body Wash Foot Soak Spray 100% Pure Tea Tree Essential Oil - 30ml
gm gumili$6.83517 rev
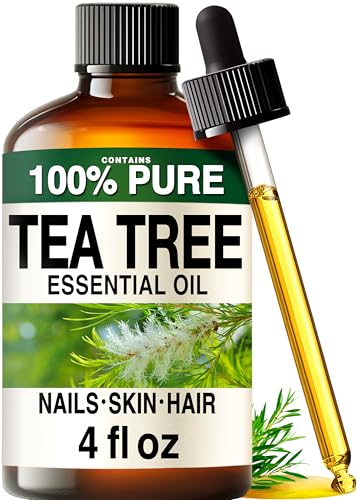
100% Pure Tea Tree Oil - 4 Fl Oz Tea Tree Essential Oil for Hair Skin Diffuser Aromatherapy & DIY Soap Making Scent
KUKKA essential oils$9.724,138 rev
Trending
90-day click momentumHIQILI Tea Tree Oil for Skin Hair Toenail
HIQILI$6.544.6★
SU JUABA Tea Tree Oil Aromatherapy Oil
SU JUABA$8.404.5★
First Botany 100% Pure Australian Tea Tree Essential Oil with high conc. of Terpinen - A Known Solution to Help in Fighting Acne Toenail Issues Dandruff. (1 fl oz)
First Botany$9.134.5★
Toenail Fungus Treatment Extra Strength Antifungal Solution and Nail Fungus Treatment for Toenail - Repairs Fungal Damaged Yellow Thick Discolored Nails - Fingernails and Toe Nail Fungus Treatments
DERMATOOL$24.984.1★
Tea Tree Oil 100% Pure Organic Tea Tree Essential Oil for Skin Face Hair Scalp Nails and Toenail 1 fl oz - By Fiora Naturals
Fiora Naturals$11.464.6★
Demand & seasonality
Weekly Amazon search volume, last 104 weeks — +9.3% search growth over the last 90 days.Peak months: Apr, May · busiest ÷ quietest = 2.3×
Reviews
What buyers praise and complain about, mined from review topics.What buyers love
“Great quality and clean product”
“Great scent”
“It does work”
“Works as advertized”
“Good value”
“makes my feet very soft”
“Very moisturizing”
“Ease of use”
“Easy to add to a carrier oil and control amount”
“I have noticed a clear improvement in the appearance of my feet”
What buyers complain about
“Chemical smell”
“Did not work”
“Watered down”
“itchy dry skin”
“Leaked oil”
“Over priced”
“Not as advertised”
“I see no improvement”
“Still good though possibly inconsistent in quality”
“Had a problem with my feet being kinda dry”