sensio miracle balm
Worth a lookShows beatable incumbent ratings (3.7★), but a failed launch gate (market size, growth, or returns) keeps it on the watch list.
Quality gap
Incredible3.7★avg incumbent rating — lower means beatable quality
Returns
Incredible0.5%return rate — above 6% kills the launch gate
Avg price
Great$18.47avg listing price — sweet spot $15–$100
Review moat
Good595.18avg incumbent reviews — the moat a new listing must climb
Price range
Good$9.64–$29.73cheapest to priciest tracked listing — scored on the share inside $15–$100
Conversion
Good5.4%search→purchase rate — share of searches ending in a sale
Growth
Good+26.2%90-day search growth — must beat 0% to launch
Market size
Good$282K$282K/yr · 285K searches
Brand share
Okay81%top-5 brand share — brands hold most of the demand
Competition
Bad73%top-5 click share — a locked-up shelf
Competition
The top 5 products capture 73% of clicks — a locked-up shelf that new listings rarely crack.Brands
14 rising
Sellers
16
Top-5 brand share
81%
Open market
15%
- Senzion Miracle Balm26%
- The Senzio26%
- CXDFTL17%
- Nasteck Mobile Parts6%
- Generic6%
- QYQIZWIA4%
- Open — no brand owns it (8 brands, 15%)
Product shelf
Each bubble is one product — market share against review moat; bubble size tracks estimated sales, color grades how beatable the incumbent looks.
All 17 tracked products in this niche — three views at once, no toggling.
Top sellers
by 90-day click share
The Senzio Senzio Miracle Balm: Herbal Powerhouse for Swollen Legs & Nerve Discomfort Made with Asian Medicinal Herbs - Relieve Swelling Fast and Support Healthy Circulation (1)
The Senzio$19.773.1★37 rev
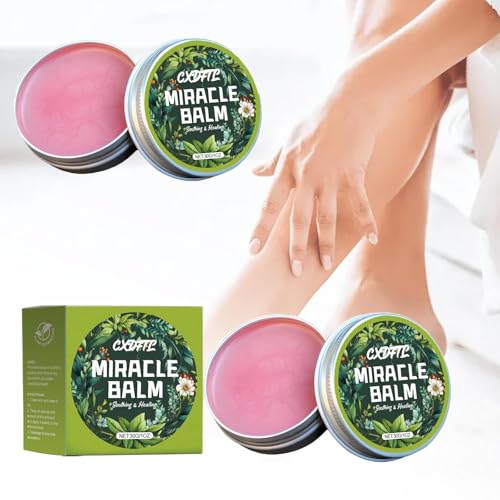
CXDFTL Miracle Balm Original Balm for Legs Arms Back 2 oz Moisturizing & Hydration Gentle and Skin-Friendly Natural Ingredients Relaxed and Comfortable 2PCS
CXDFTL$21.863.4★52 rev
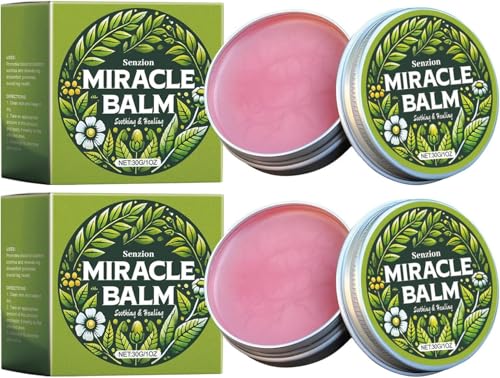
Senzion Official Balm 2 Pack Natural Ingredients Senzion Balm for Legs Arms Back
Senzion Miracle Balm$22.253.9★171 rev
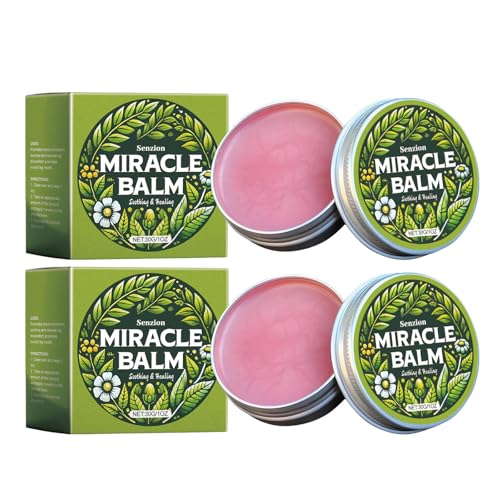
Original Senzion Miracle Balm Natural Ingredients for Back Hands Feet and Body
Senzion Miracle Balm$22.273.1★11 rev
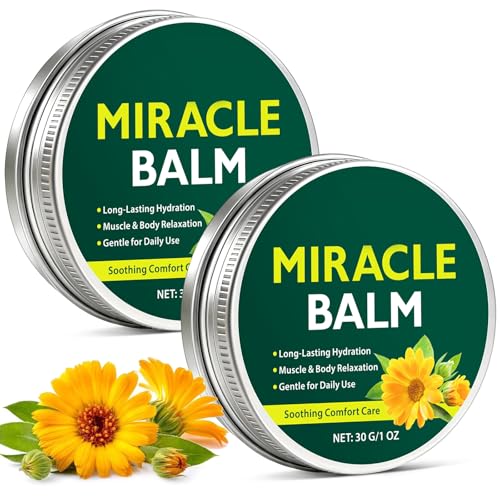
2 Box Miracle Balm Natural Ingredients Relaxed and Comfortable Balm for for Legs Arms Back
Generic$14.864.0★54 rev
Newest
by launch date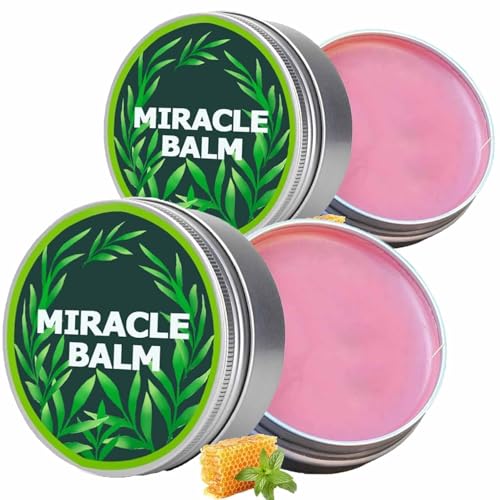
Miracle Balm for Swollen Legs Veins Soothing Relaxing & Comfortable Botanical Formula with Calendula for Back Hands Feet and Body(2BOXS)
BXFGMG$21.020 rev
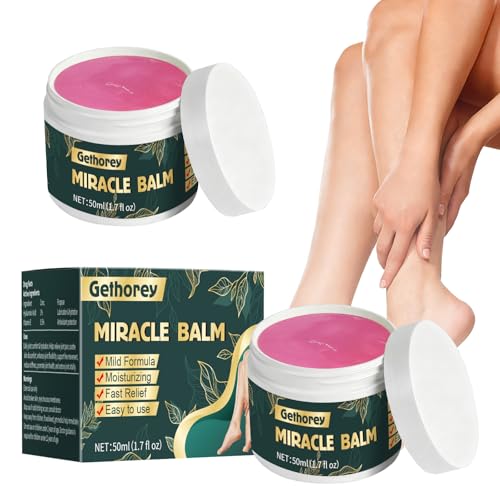
Gethorey Miracle Balm Joint Relief & Hydration Balm - Hyaluronic Acid & Vitamin E Moisturizing Formula - Fast-Acting Soothing Support for Joint & Skin Comfort-A02
Gethorey$10.1329 rev
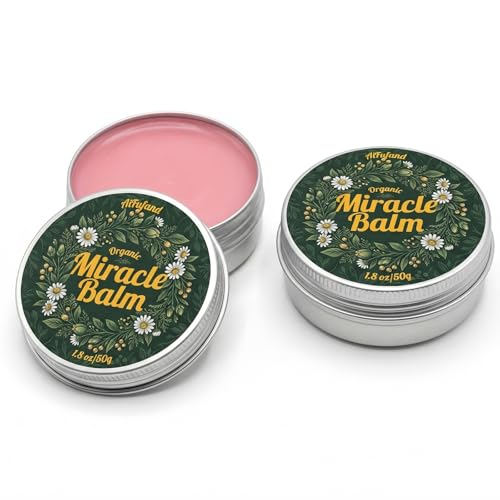
AIFUFAND Miracle Balm Botanical Moisturizing Balm for Dry Skin 1.8 oz each (Pack of 2)
AIFUFAND$20.701 rev
The Senzio Senzio Miracle Balm: Herbal Powerhouse for Swollen Legs & Nerve Discomfort Made with Asian Medicinal Herbs - Relieve Swelling Fast and Support Healthy Circulation (1)
The Senzio$19.7737 rev
The Senzio Senzio Miracle Balm: Herbal Powerhouse for Swollen Legs & Nerve Discomfort Made with Asian Medicinal Herbs - Relieve Swelling Fast and Support Healthy Circulation (2)
The Senzio$29.7337 rev
Trending
90-day click momentumGethorey Miracle Balm Joint Relief & Hydration Balm - Hyaluronic Acid & Vitamin E Moisturizing Formula - Fast-Acting Soothing Support for Joint & Skin Comfort-A02
Gethorey$10.134.2★
CXDFTL Miracle Balm Original Balm for Legs Arms Back 2 oz Moisturizing & Hydration Gentle and Skin-Friendly Natural Ingredients Relaxed and Comfortable 2PCS
CXDFTL$21.863.4★
AIFUFAND Miracle Balm Botanical Moisturizing Balm for Dry Skin 1.8 oz each (Pack of 2)
AIFUFAND$20.703.0★
The Senzio Senzio Miracle Balm: Herbal Powerhouse for Swollen Legs & Nerve Discomfort Made with Asian Medicinal Herbs - Relieve Swelling Fast and Support Healthy Circulation (2)
The Senzio$29.733.1★
The Senzio Senzio Miracle Balm: Herbal Powerhouse for Swollen Legs & Nerve Discomfort Made with Asian Medicinal Herbs - Relieve Swelling Fast and Support Healthy Circulation (1)
The Senzio$19.773.1★
Demand & seasonality
Weekly Amazon search volume, last 75 weeks — +26.2% search growth over the last 90 days.Peak months: Jun, Jul · busiest ÷ quietest = 3.2×
Reviews
What buyers praise and complain about, mined from review topics.What buyers love
“It smells delightful”
“Excellent Product”
“Does the job”
“Love this for my joints”
“Soothing and moisturizing”
“feels very smooth”
“Great for more than just muscles”
“Relieves pain and inflammation”
“Its a great value for the money”
“Works as advertised”
What buyers complain about
“Does not work as advertised”
“No relief”
“I am quite disappointed with the discrepancy between the product description”
“Over priced”
“SMALL”
“It's as hard as a rock”
“I do not like the strong smell as well”
“No idea what is in this product”
“I am assuming I had an allergic reaction”
“the warming effect isn't on the ingredient list”