samnyte tattoo numbing cream
Skip itA small market ($6K/yr) — this niche doesn't clear our bar today.
Returns
Incredible0.2%return rate — above 6% kills the launch gate
Avg price
Great$22.55avg listing price — sweet spot $15–$100
Quality gap
Great4.2★avg incumbent rating — lower means beatable quality
Price range
Great$8.24–$38.68cheapest to priciest tracked listing — scored on the share inside $15–$100
Brand share
Okay75%top-5 brand share — brands hold most of the demand
Competition
Okay58%top-5 click share — leaders hold, buyers still browse
Review moat
Bad10,384.84avg incumbent reviews — the moat a new listing must climb
Growth
Bad-18.5%90-day search growth — must beat 0% to launch
Conversion
Bad1.2%search→purchase rate — share of searches ending in a sale
Market size
Bad$6K$6K/yr · 22K searches
Competition
The top 5 products take 58% of clicks — established leaders, but buyers still shop beyond them.Brands
12 rising
Sellers
28
Top-5 brand share
75%
Open market
20%
- Zensa27%
- Ebanel21%
- Aemerry13%
- Nupharmco9%
- Treatonic5%
- tuiwaro5%
Product shelf
Each bubble is one product — market share against review moat; bubble size tracks estimated sales, color grades how beatable the incumbent looks.
All 19 tracked products in this niche — three views at once, no toggling.
Top sellers
by 90-day click share
Zensa Numbing Cream 5% Lidocaine Maximum Strength Topical Anesthetic with Vitamin E for Pain Relief from Hemorrhoids Vegan Cruelty-Free Water-Based Physiologic pH for Sensitive Skin 30g
Zensa$38.684.2★5,137 rev

Ebanel 5% Lidocaine Numbing Cream Pain Relief Burn Itch Numb Cream Maximum Strength Topical Anesthetic with Allantoin Vitamin E for Local and Anorectal Uses Hemorrhoid Treatment 1.35 Oz
Ebanel$17.824.1★78,231 rev

Numbing Cream Maximum Strength: Long Lasting Extra Relief with Menthol Arnica and Emu Oil for Hemorrhoids and Other Minor Anorectal Irritations 60ml
Nupharmco$24.074.3★344 rev
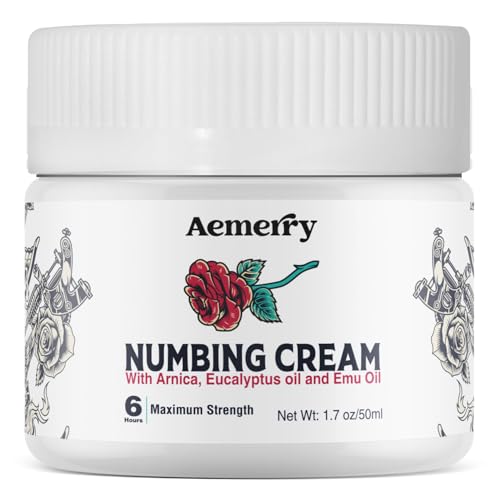
Tattoo Numbing CreamMaximum Strength: Numbing Cream for Tattoos Extra Strength Numbing Cream - Up to 6 Hours Numbness for Multi-Purpose Use (White 1.7 Ounce (Pack of 1))
Aemerry$21.374.2★314 rev
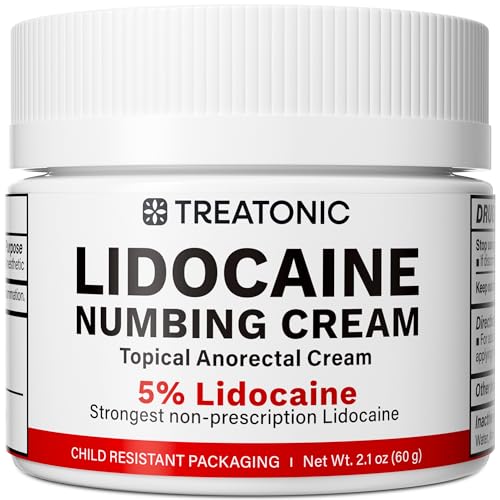
Treatonic 5% Lidocaine Numbing Cream: Lidocaine Cream Maximum Strength for Pain Relief Itching Burning Soreness Hemorrhoid Treatment - Fast Acting & Long Lasting Numbing - 2.1 oz
Treatonic$21.304.3★2,953 rev
Newest
by launch date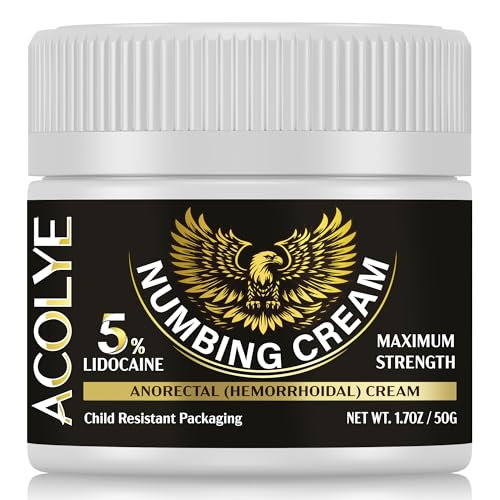
Acolye Numbing Cream Extra Strength: 5% Lidocaine Local Anesthetic- Long Lasting Extra Relief with Menthol Arnica and Emu Oil 1.7 Fl Oz
Acolye$22.8442 rev
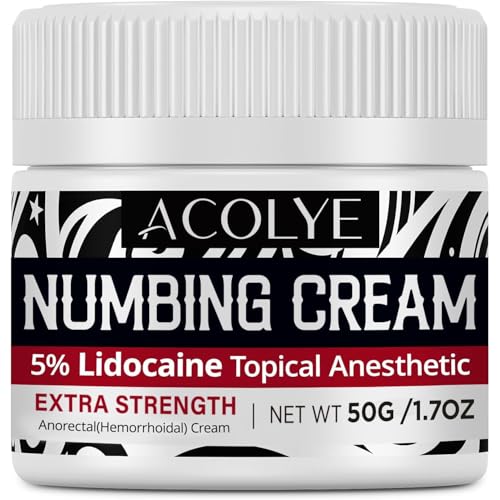
Acolye Numbing Cream Extra Strength: 5% Lidocaine Local Anesthetic- Long Lasting Extra Relief with Menthol Arnica and Emu Oil
Acolye$20.98228 rev

Numbing Cream Maximum Strength: Extra Strength Numbing Cream - Up to 6 Hours Numbness for Multi-Purpose Use - (50ml/1.7oz)
Aemerry$20.9265 rev
Numbing Cream Maximum Strength: Long Lasting Extra Relief with Menthol Arnica and Emu Oil for Hemorrhoids and Other Minor Anorectal Irritations 60ml
Nupharmco$24.07344 rev
Numbing Cream Maximum Strength: Extra Strength Numbing Cream - Up to 6 Hours Numbness for Multi-Purpose Use
Aemerry$19.43175 rev
Trending
90-day click momentumAcolye Numbing Cream Extra Strength: 5% Lidocaine Local Anesthetic- Long Lasting Extra Relief with Menthol Arnica and Emu Oil 1.7 Fl Oz
Acolye$22.843.8★
Acolye Numbing Cream Extra Strength: 5% Lidocaine Local Anesthetic- Long Lasting Extra Relief with Menthol Arnica and Emu Oil
Acolye$20.984.2★

Curist 5% Lidocaine Cream Pain Relief - Numb Quickly & Effectively with 5% Lidocaine Numbing Cream for Anorectal Use - (1 Pack - 2 oz Jar)
Curist$12.044.3★
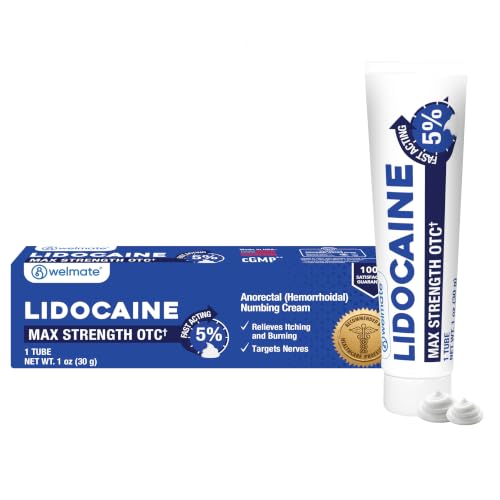
WELMATE 5% Lidocaine Cream for Hemorrhoids Maximum Strength Numbing Cream Fast-Acting Anorectal Relief Non-Greasy Unscented Child Resistant Cap 1 oz (30g)
WELMATE$8.244.3★
Numbing Cream Maximum Strength: Long Lasting Extra Relief with Menthol Arnica and Emu Oil for Hemorrhoids and Other Minor Anorectal Irritations 60ml
Nupharmco$24.074.3★
Demand & seasonality
Weekly Amazon search volume, last 104 weeks — -18.5% search growth over the last 90 days.Peak months: Jun, Aug · busiest ÷ quietest = 2.4×
Reviews
What buyers praise and complain about, mined from review topics.What buyers love
“very effective for me”
“pricing for quality”
“Worth buying”
“As advertised”
“Ease of use”
“Lasted the whole time”
“Easy to apply”
“smells good”
“was very comfortable I”
“directions were clear”
What buyers complain about
“This barely worked”
“BUT THE SPONGE CAME RIGHT OFF ON THE SECOND USE”
“My hands are what hurts”
“The bottle is small”
“It stinks”
“Too expensive”
“sadly it started burning”
“Bumps and irritation”
“Garbage”
“not as described”