relion premier test strips
Skip itA small market ($30K/yr) — this niche doesn't clear our bar today.
Avg price
Incredible$26.21avg listing price — sweet spot $15–$100
Price range
Great$6.12–$64.61cheapest to priciest tracked listing — scored on the share inside $15–$100
Competition
Great37%top-5 click share — an open shelf
Returns
Great1.8%return rate — above 6% kills the launch gate
Review moat
Good766.71avg incumbent reviews — the moat a new listing must climb
Brand share
Good66%top-5 brand share — brands hold most of the demand
Conversion
Okay2.5%search→purchase rate — share of searches ending in a sale
Quality gap
Okay4.6★avg incumbent rating — lower means beatable quality
Growth
Bad-2.1%90-day search growth — must beat 0% to launch
Market size
Bad$30K$30K/yr · 45K searches
Competition
Clicks spread well past the top 5 (37% combined) — an open shelf where new products get seen.Brands
20 falling
Sellers
223
Top-5 brand share
66%
Open market
30%
- LUAL21%
- Reli On15%
- Twefopy12%
- ME GUSTA SHOP10%
- ReliOn8%
- Haylos5%
Product shelf
Each bubble is one product — market share against review moat; bubble size tracks estimated sales, color grades how beatable the incumbent looks.
All 41 tracked products in this niche — three views at once, no toggling.
Top sellers
by 90-day click share
ReliOn 30G Ultra-Thin Lancets 100-ct (Pack of 2)
Twefopy$9.464.8★521 rev

Premier Glucose Monitor Starter Kit with Strips Lancets & Lancing. Full Diabetes Testing Bundle with Lualls 45 Diabetes Decoded
LUAL$55.594.5★61 rev
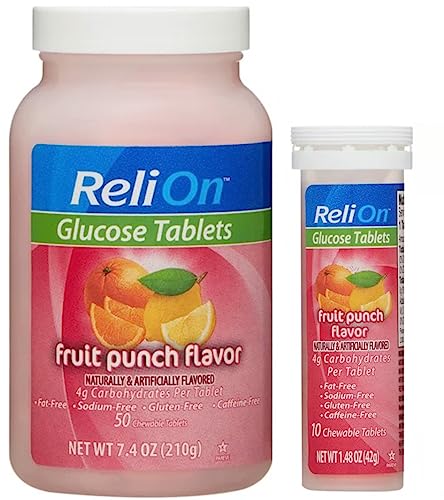
ReliOn Glucose 50 Tablets with On-The-Go Tube 10 Tablets. (Fruit Punch)
Reli On$14.304.7★945 rev

Relion Premier Blood Glucose Monitoring System Classic by Reli On
ReliOn$19.554.5★829 rev
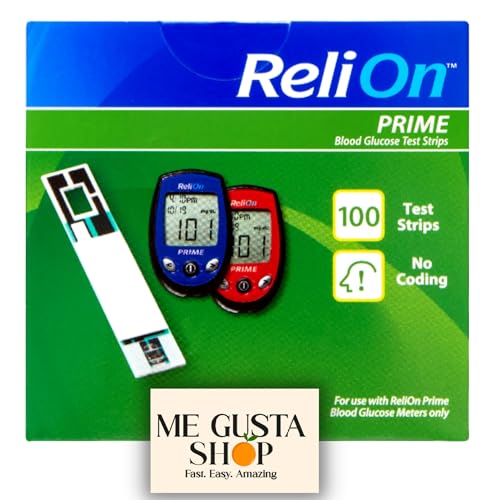
ReliOn Prime Blood Glucose Test Strips 100 Ct + me Gusta Sticker
ME GUSTA SHOP$32.664.9★22 rev
Newest
by launch date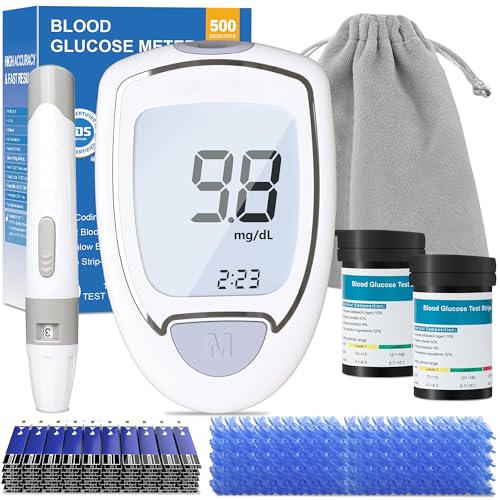
Blood Glucose Monitor Glucometer Kit with 100 Strips and Lancets Diabetic Testing Kit with Auto Eject No Coding Large Display for Seniors Blood Sugar Testing Kit for Travel & Home Use
CAKRNPS$23.97560 rev
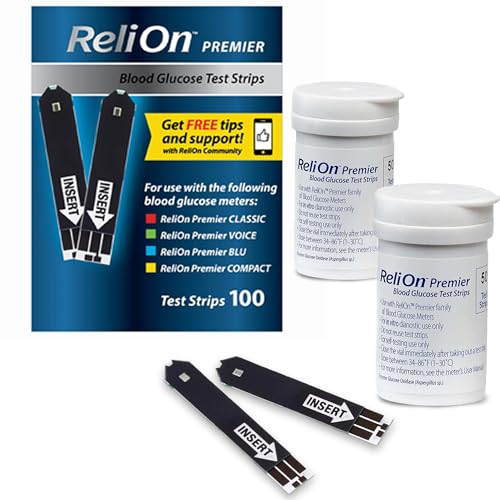
Blood Glucose Test Strips | 100 Count | Diabetic Supplies for Glucose Monitor | Accurate Blood Glucose Monitoring | Tiras para Medir la Glucosa Compatible with Re Lion Premier Meters
Generic$34.843 rev
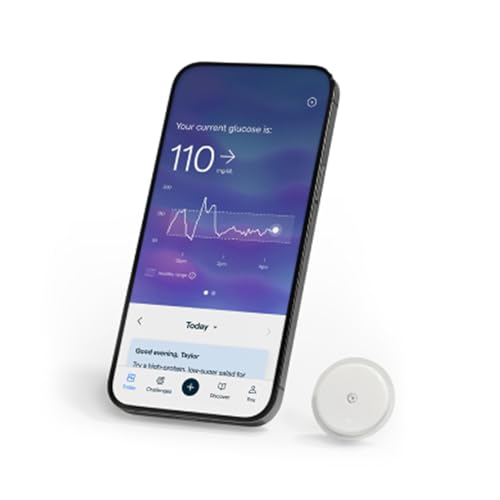
Lingo Continuous Glucose Monitor (CGM). Made by Abbott. Optimize Your Nutrition with Real-time Glucose Data & Insights. 1 Lingo biosensor lasts up to 14 Days*. Works with iOS and Android. US Only.
Lingo$45.174,783 rev
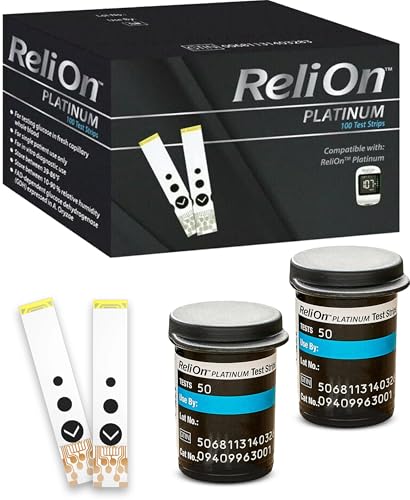
Blood Glucose Test Strips 100 Count | Ideal for Glucose Monitor Kit Glucose Level Testing | Reliable Readings | Accurate & Easy to Use | High Accuracy Strips
Generic$35.704 rev

G-425-1 Blood Glucose Monitor Kit 100 Test Strips &100 Lancets 1 Control Solution 1 Blood Sugar Monitor 1 Lancing Device Diabetes Testing Kit No Coding Large Display Glucometer for Home Use
LinkSun$22.361,956 rev
Trending
90-day click momentum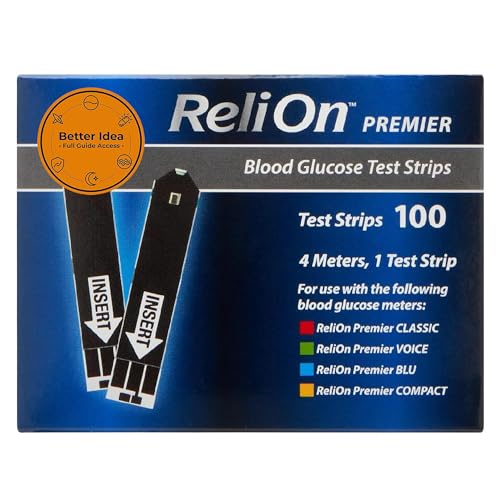
Premier 100 Count Test Strips No Coding Required - Accurate Monitoring - Care - for Use with.
Generic$33.923.2★
ReliOn Prime Blood Glucose Test Strips 100 Ct + me Gusta Sticker
ME GUSTA SHOP$32.664.9★
Blood Glucose Monitor Glucometer Kit with 100 Strips and Lancets Diabetic Testing Kit with Auto Eject No Coding Large Display for Seniors Blood Sugar Testing Kit for Travel & Home Use
CAKRNPS$23.974.3★
Blood Glucose Test Strips | 100 Count | Diabetic Supplies for Glucose Monitor | Accurate Blood Glucose Monitoring | Tiras para Medir la Glucosa Compatible with Re Lion Premier Meters
Generic$34.844.6★
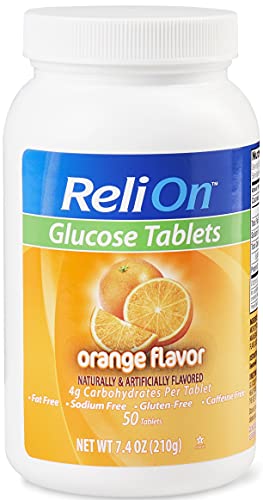
Relion Glucose Tablets - Orange Flavor - 50 Counts
ReliOn$9.634.7★
Demand & seasonality
Weekly Amazon search volume, last 104 weeks — -2.1% search growth over the last 90 days.Peak months: Jul, Aug · busiest ÷ quietest = 2.5×
Reviews
What buyers praise and complain about, mined from review topics.What buyers love
“Easy peasy”
“Fair Price”
“have been happy with the quality of that sensor”
“Good for low sugar”
“Helps me stay on track”
“Exactly as described”
“Does the job”
“Easy and accurate”
“The instructions are clear”
“It did not hurt installing it”
What buyers complain about
“Breaks Easily”
“Inconsistent readings”
“Did not Work”
“Does not connect”
“NOT ACCURATE”
“Contains BAD Things for Diabeticx”
“Too expensive”
“Poor quality control”
“the app is terrible”
“Bad instructions”