pronerve 6
Worth a lookShows low returns (0.1%), but a concentrated shelf (top 5 take 100% of clicks) keeps it on the watch list.
Returns
Incredible0.1%return rate — above 6% kills the launch gate
Review moat
Incredible42.75avg incumbent reviews — the moat a new listing must climb
Quality gap
Incredible3.8★avg incumbent rating — lower means beatable quality
Conversion
Incredible13.2%search→purchase rate — share of searches ending in a sale
Avg price
Incredible$35.80avg listing price — sweet spot $15–$100
Price range
Incredible$19.80–$53.91cheapest to priciest tracked listing — scored on the share inside $15–$100
Growth
Okay+9.6%90-day search growth — must beat 0% to launch
Market size
Bad$13K$13K/yr · 3K searches
Competition
Bad100%top-5 click share — a locked-up shelf
Brand share
Bad100%top-5 brand share — brand-locked demand
Competition
The top 5 products capture 100% of clicks — a locked-up shelf that new listings rarely crack.Brands
4 falling
Sellers
4
Top-5 brand share
100%
Open market
0%
- LIVORKA55%
- The Sunrise Brand22%
- Indelo14%
- kivus8%
Product shelf
Each bubble is one product — market share against review moat; bubble size tracks estimated sales, color grades how beatable the incumbent looks.
All 4 tracked products in this niche — three views at once, no toggling.
Top sellers
by 90-day click share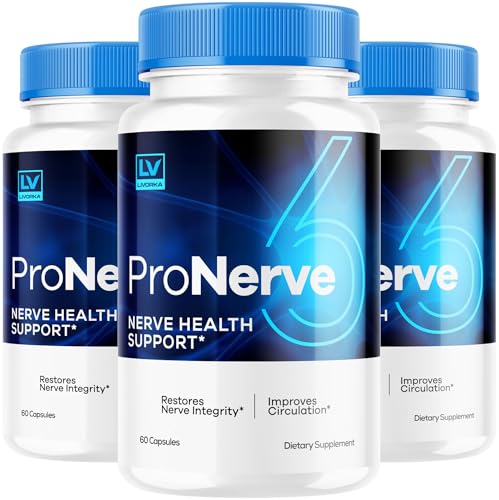
Pronerve 6 Nerve Health Advanced Formula Supplement Support Pills - 180 Capsules (3 Month Supply) - Pack of 3
LIVORKA$35.084.0★83 rev
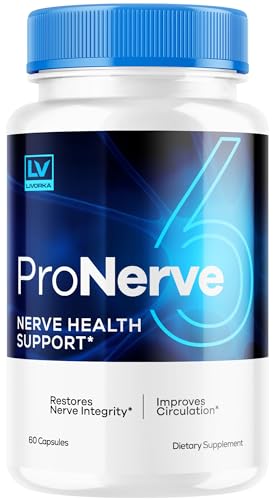
Pronerve 6 Pronerve6Capsules Pronerve6 Reviews ProNerve6 Focus Health Support ProNerve6Pills ProNerve6 Advanced Formula for 1 Month
The Sunrise Brand$19.803.4★39 rev
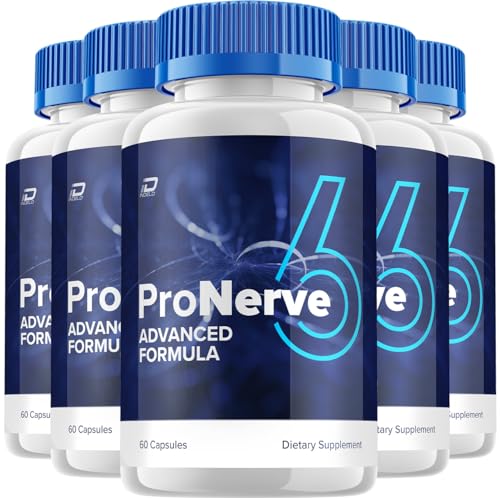
ProNerve 6 Capsules Advanced Nerve Formula Nerve Pro Pills (5 Pack - 300 Capsules)
Indelo$53.914.4★22 rev
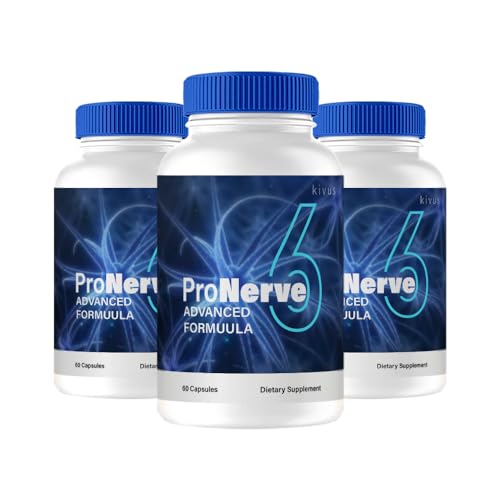
kivus Pronerve 6 - Pronerve 6 Advanced Capsules (3 Pack 180 Capsules)
kivus$34.403.5★27 rev
Newest
by launch datePronerve 6 Nerve Health Advanced Formula Supplement Support Pills - 180 Capsules (3 Month Supply) - Pack of 3
LIVORKA$35.0883 rev
Pronerve 6 Pronerve6Capsules Pronerve6 Reviews ProNerve6 Focus Health Support ProNerve6Pills ProNerve6 Advanced Formula for 1 Month
The Sunrise Brand$19.8039 rev
kivus Pronerve 6 - Pronerve 6 Advanced Capsules (3 Pack 180 Capsules)
kivus$34.4027 rev
ProNerve 6 Capsules Advanced Nerve Formula Nerve Pro Pills (5 Pack - 300 Capsules)
Indelo$53.9122 rev
Trending
90-day click momentumPronerve 6 Nerve Health Advanced Formula Supplement Support Pills - 180 Capsules (3 Month Supply) - Pack of 3
LIVORKA$35.084.0★
Pronerve 6 Pronerve6Capsules Pronerve6 Reviews ProNerve6 Focus Health Support ProNerve6Pills ProNerve6 Advanced Formula for 1 Month
The Sunrise Brand$19.803.4★
kivus Pronerve 6 - Pronerve 6 Advanced Capsules (3 Pack 180 Capsules)
kivus$34.403.5★
ProNerve 6 Capsules Advanced Nerve Formula Nerve Pro Pills (5 Pack - 300 Capsules)
Indelo$53.914.4★
Demand & seasonality
Weekly Amazon search volume, last 98 weeks — +9.6% search growth over the last 90 days.Peak months: Oct, Nov, Dec · busiest ÷ quietest = 12.3×
Reviews
What buyers praise and complain about, mined from review topics.What buyers love
“hope it works”