pemf mat
Skip itWeak search conversion (0.4%) — this niche doesn't clear our bar today.
Quality gap
Great4.2★avg incumbent rating — lower means beatable quality
Market size
Okay$212K$212K/yr · 238K searches
Avg price
Okay$241.46avg listing price — sweet spot $15–$100
Returns
Okay5.3%return rate — above 6% kills the launch gate
Brand share
Okay88%top-5 brand share — brands hold most of the demand
Review moat
Bad5,430.75avg incumbent reviews — the moat a new listing must climb
Competition
Bad75%top-5 click share — a locked-up shelf
Price range
Bad$21.41–$836.55cheapest to priciest tracked listing — scored on the share inside $15–$100
Growth
Bad-34.3%90-day search growth — must beat 0% to launch
Conversion
Bad0.4%search→purchase rate — share of searches ending in a sale
Competition
The top 5 products capture 75% of clicks — a locked-up shelf that new listings rarely crack.Brands
9 falling
Sellers
13
Top-5 brand share
88%
Open market
8%
- FENBAS48%
- HealthyLine17%
- EARTHVERA10%
- NIULAFR8%
- ProsourceFit5%
- Sparkle Energy4%
- Open — no brand owns it (3 brands, 8%)
Product shelf
Each bubble is one product — market share against review moat; bubble size tracks estimated sales, color grades how beatable the incumbent looks.
All 12 tracked products in this niche — three views at once, no toggling.
Top sellers
by 90-day click share
Grounding Mat
FENBAS$29.623.9★11 rev
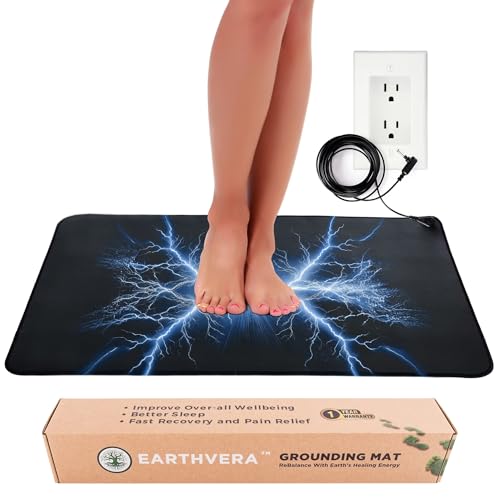
EARTHVERA Grounding Mat for Feet & Desk 2416 - Earthing Pad for Pain Relief Better Sleep & Stress Relief - Conductive Carbon Vegan Leather Grounding Pad with 15ft Cord for Bed Couch Office
EARTHVERA$21.764.4★79 rev

Grounding Mat 35.4x23.6 inches Reconnect to The Earth EMF Recovery for Foot Therapy Carbon Fiber Universal Grounding Mat for Feet Improve Energy Sleep Assist and Helps with Anxiety
NIULAFR$22.354.1★1,363 rev
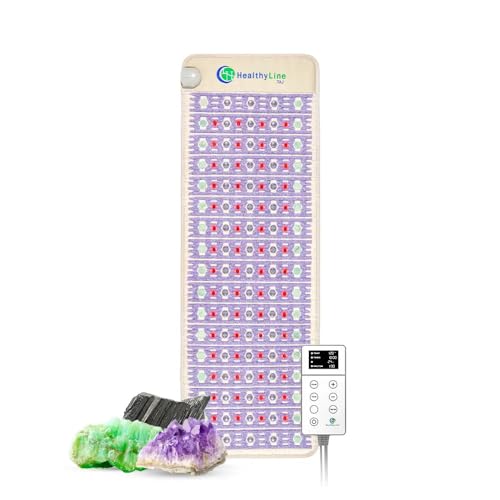
F Advanced Far Infrared Heating Pad - Professional Biomat for Pain Relief and Healing - Pulsed Electromagnetic Field Therapy - Full Body Mat with Red Lights Amethyst Tourmaline and Jade - 72 x 24
HealthyLine$836.554.3★204 rev
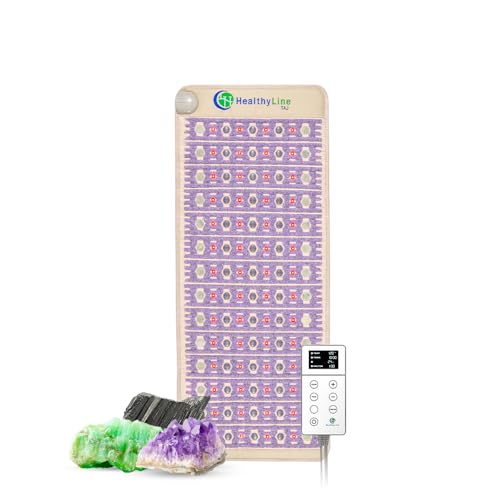
F Advanced Far Infrared Heating Pad - Professional Biomat for Pain Relief and Healing - Pulsed Electromagnetic Field Therapy - Full Body Mat with Red Lights Amethyst Tourmaline and Jade - 60 x 24
HealthyLine$708.314.3★204 rev
Newest
by launch date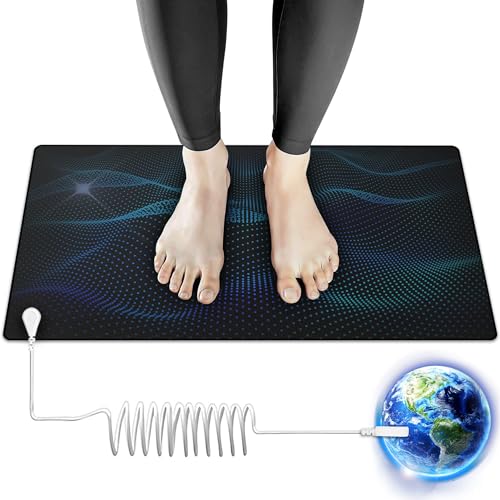
Grounding Mat for Sleep Energy Pain Relief Inflammation Balance Wellness Earth Connection Therapy for Indoor Grounding at Home Office or Work 16x24
FENBAS$27.386 rev
Grounding Mat
FENBAS$29.6211 rev

Comfytemp 33 x 17 Red Light Mat Wearable Near Infrared Light Pad Flexible Light Blanket with Timer 660nm & 850nm
Comfytemp$109.901,039 rev
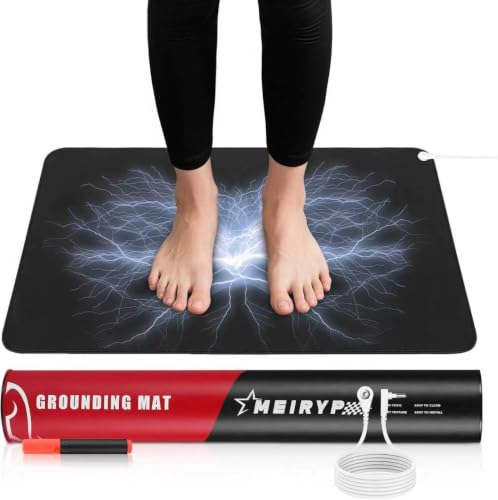
Polfeite Professional Grounding Mat with Carbon Fiber Technology | 24x16 Indoor Earthing Pad + 15ft Medical-Grade Cord | Cellular Energy Renewal & Inflammation Support
Polfeite$29.21127 rev
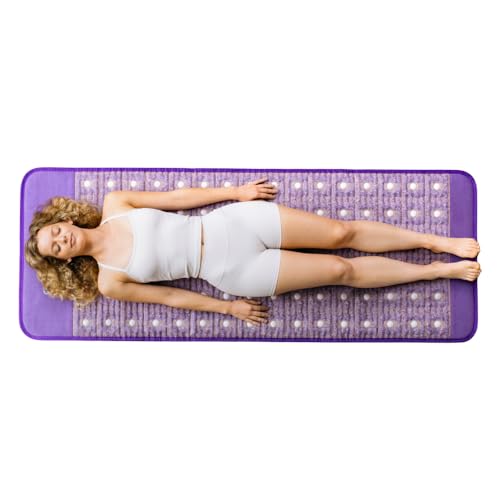
Biomat Infrared Mat | Crystal Mat for Therapy | Infrared Heating Mat | Red Light Therapy for Body | Hot Gemstone Therapy | Promotes for Muscle & Back Pain Relief | Sparkle Mat (Full Size)
Sparkle Energy$805.01112 rev
Trending
90-day click momentumGrounding Mat
FENBAS$29.623.9★
Grounding Mat for Sleep Energy Pain Relief Inflammation Balance Wellness Earth Connection Therapy for Indoor Grounding at Home Office or Work 16x24
FENBAS$27.383.5★
Grounding Mat 35.4x23.6 inches Reconnect to The Earth EMF Recovery for Foot Therapy Carbon Fiber Universal Grounding Mat for Feet Improve Energy Sleep Assist and Helps with Anxiety
NIULAFR$22.354.1★
EARTHVERA Grounding Mat for Feet & Desk 2416 - Earthing Pad for Pain Relief Better Sleep & Stress Relief - Conductive Carbon Vegan Leather Grounding Pad with 15ft Cord for Bed Couch Office
EARTHVERA$21.764.4★
Polfeite Professional Grounding Mat with Carbon Fiber Technology | 24x16 Indoor Earthing Pad + 15ft Medical-Grade Cord | Cellular Energy Renewal & Inflammation Support
Polfeite$29.214.0★
Demand & seasonality
Weekly Amazon search volume, last 104 weeks — -34.3% search growth over the last 90 days.Peak months: Jan · busiest ÷ quietest = 2.1×
Reviews
What buyers praise and complain about, mined from review topics.What buyers love
“Very nice product with solid quality”
“Easy to use”
“comfortable to use”
“Good value”
“I feel that it helps me sleep better”
“Just the right size”
“Its effective”
“accurate product description”
“Joint relief”
“the material is soft”
What buyers complain about
“didn't see any results”
“Does not last”
“Waste of money”
“Overheated”
“Smells like nasty plastic”
“I didnt understand the product instructions because it was confusing”
“At first, there was a slight tingle in one of my thighs”
“I can't tell if it helped with my swelling or not”
“Yes initially it is uncomfortable”
“It may be too hard for sensitive skin you can lay over a thin towel or sheet”