orange oil
Worth a lookShows low returns (0.4%), but a failed launch gate (market size, growth, or returns) keeps it on the watch list.
Returns
Incredible0.4%return rate — above 6% kills the launch gate
Competition
Great30%top-5 click share — an open shelf
Avg price
Great$17.56avg listing price — sweet spot $15–$100
Price range
Great$5.74–$52.44cheapest to priciest tracked listing — scored on the share inside $15–$100
Conversion
Great7.4%search→purchase rate — share of searches ending in a sale
Market size
Good$645K$645K/yr · 496K searches
Brand share
Okay80%top-5 brand share — brands hold most of the demand
Review moat
Okay2,915.39avg incumbent reviews — the moat a new listing must climb
Quality gap
Okay4.6★avg incumbent rating — lower means beatable quality
Growth
Bad-4.4%90-day search growth — must beat 0% to launch
Competition
Clicks spread well past the top 5 (30% combined) — an open shelf where new products get seen.Brands
21 flat
Sellers
132
Top-5 brand share
80%
Open market
18%
- NOW Foods57%
- HOWARD8%
- Green Gobbler7%
- Medina4%
- Handcraft Blends3%
- Majestic Pure2%
Product shelf
Each bubble is one product — market share against review moat; bubble size tracks estimated sales, color grades how beatable the incumbent looks.
All 57 tracked products in this niche — three views at once, no toggling.
Top sellers
by 90-day click share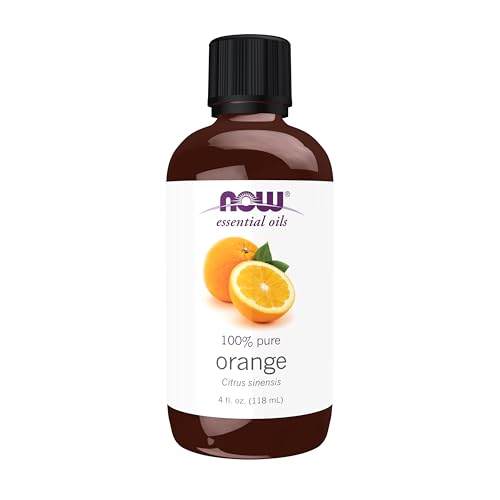
NOW Essential Oils Orange Oil Uplifting Aromatherapy Scent Cold Pressed 100% Pure Vegan Child Resistant Cap 4-Ounce
NOW Foods$6.824.5★5,155 rev
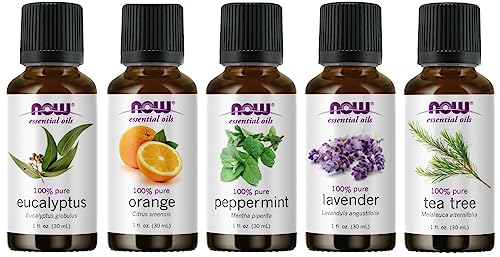
Now Foods Essential Oil 5-Pack Variety Sampler 1 Ounce
NOW Foods$30.774.6★1,372 rev

Howard Products ORS016 Orange Oil Wood Polish 16 oz
HOWARD$12.874.7★5,887 rev

Green Gobbler All-Natural Cold Pressed Concentrated Orange Oil for Home and Outdoor Multi-Purpose Cleaning- Hundreds of Uses 32 oz
Green Gobbler$26.544.6★5,102 rev
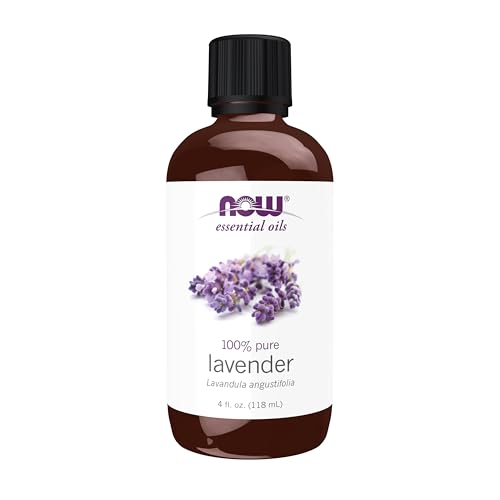
NOW Essential Oils Lavender Oil Soothing Aromatherapy Scent Steam Distilled 100% Pure Vegan Child Resistant Cap 4-Ounce
NOW Foods$23.634.5★8,253 rev
Newest
by launch date
SU JUABA Orange Essential Oil 4 Fl Oz- 118ML
SU JUABA$8.31146 rev
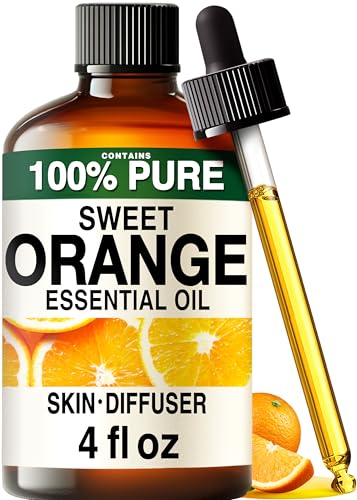
100% Pure Orange Oil - 4 Fl Oz Orange Essential Oil for Hair Skin Diffuser Aromatherapy & DIY Soap Making Scent
KUKKA essential oils$9.66840 rev

Green Gobbler Cold Pressed Orange Oil Concentrate - 22.5 oz (D-Limonene) Multi-Purpose Home and Outdoor Cleaner (2 PACK)
Green Gobbler$29.621,349 rev

Cold Pressed Orange Oil Concentrate | 8-ounce Professional Grade All-Purpose Citrus Cleaner Degreaser & Pet Odor Eliminator Blend | Dilutes to 4 Gallons of Finished Product | Home and Outdoor Use
Sanco Industries$13.01992 rev

Brooklyn Botany Sweet Orange Essential Oil - Huge 4 Fl Oz - 100% Pure and Natural - Premium Grade with Dropper - for Aromatherapy and Diffuser
Brooklyn Botany$9.511,878 rev
Trending
90-day click momentum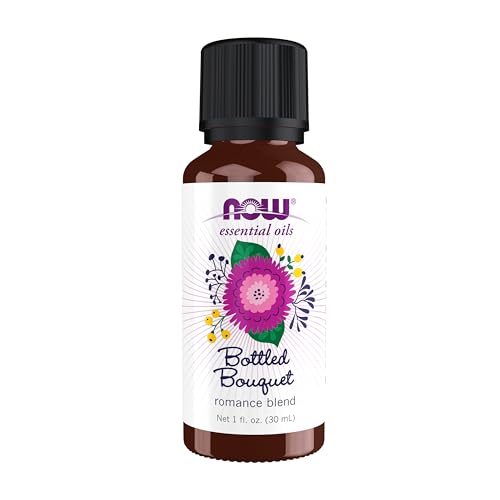
NOW Essential Oils Bottled Bouquet Oil Blend Floral Aromatherapy Scent Blend of Pure Essential Oils Vegan Child Resistant Cap 1-Ounce
NOW Foods$12.514.3★
SU JUABA Orange Essential Oil 4 Fl Oz- 118ML
SU JUABA$8.314.4★
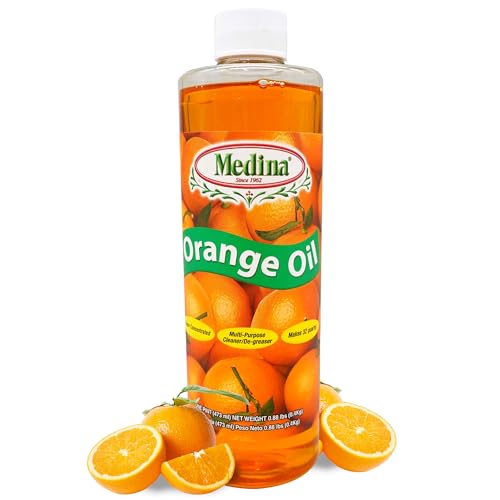
Medina Orange Oil Cleaner & Degreaser Concentrate - All Purpose Orange Oil Cleaner Cabinet Cleaner Degreaser Wood Degreaser for Kitchen Cabinets Ideal for Mopping Floors & Automotive - 16oz
Medina$23.234.7★
NOW Essential Oils Orange Oil Uplifting Aromatherapy Scent Cold Pressed 100% Pure Vegan Child Resistant Cap 4-Ounce
NOW Foods$6.824.5★
Green Gobbler All-Natural Cold Pressed Concentrated Orange Oil for Home and Outdoor Multi-Purpose Cleaning- Hundreds of Uses 32 oz
Green Gobbler$26.544.6★
Demand & seasonality
Weekly Amazon search volume, last 104 weeks — -4.4% search growth over the last 90 days.Peak months: Jun, Jul, Sep, Nov · busiest ÷ quietest = 3.8×
Reviews
What buyers praise and complain about, mined from review topics.What buyers love
“Smells delish”
“Quality was solid”
“Great value”
“As advertised”
“the wood looks beautiful”
“It does shine”
“Ease of use”
“Love it for cleaning”
“This product is very effective”
“You can tell they use high quality ingredients”
What buyers complain about
“Scent was too strong”
“One was leaking”
“Make things difficult”
“The quality is cheap”
“This one - is an oily product that does not have the smell of an orange”
“Doesn't work”
“Waste of money”
“Product is diluted”
“Not strong enough”
“I'm disappointed because the number one ingredient is castor oil when I thought it should be de-lemone or orange oil cuz that's what I'm buying”