no2
Worth a lookShows low returns (0.0%), but soft demand (-7.2% this quarter) keeps it on the watch list.
Returns
Incredible0.0%return rate — above 6% kills the launch gate
Avg price
Incredible$30.01avg listing price — sweet spot $15–$100
Price range
Great$9.65–$76.27cheapest to priciest tracked listing — scored on the share inside $15–$100
Conversion
Good6.9%search→purchase rate — share of searches ending in a sale
Quality gap
Good4.4★avg incumbent rating — lower means beatable quality
Brand share
Okay80%top-5 brand share — brands hold most of the demand
Market size
Okay$187K$187K/yr · 90K searches
Competition
Okay69%top-5 click share — leaders hold, buyers still browse
Review moat
Bad6,533.59avg incumbent reviews — the moat a new listing must climb
Growth
Bad-7.2%90-day search growth — must beat 0% to launch
Competition
The top 5 products take 69% of clicks — established leaders, but buyers still shop beyond them.Brands
13 falling
Sellers
44
Top-5 brand share
80%
Open market
16%
- Nutricost34%
- MRI20%
- Jacked Factory15%
- Snap Supplements6%
- Carlyle5%
- Force Factor4%
- Open — no brand owns it (7 brands, 16%)
Product shelf
Each bubble is one product — market share against review moat; bubble size tracks estimated sales, color grades how beatable the incumbent looks.
All 17 tracked products in this niche — three views at once, no toggling.
Top sellers
by 90-day click share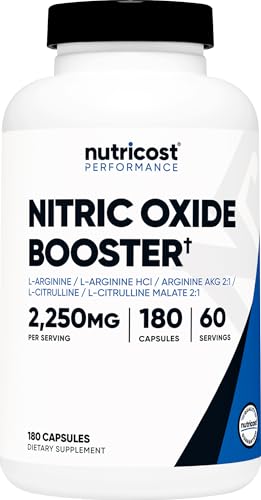
Nutricost Nitric Oxide Booster 2250mg 180 Capsules - 750mg Per Casule 60 Servings - Gluten Free and Non-GMO
Nutricost$14.774.5★13,609 rev
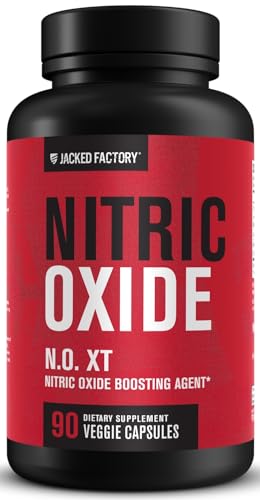
Jacked Factory N.O. XT Nitric Oxide Supplements for Men w/Nitrosigine L Arginine L Citrulline Supplement for Muscle Pumps & Vascularity - Pre Workout Nitric Oxide Booster & Muscle Builder - 90 Caps
Jacked Factory$23.624.3★15,564 rev

MRI NO2 Nitric Oxide Booster 3000mg L-Arginine & AAKG (90 Caplets)
MRI$25.784.2★254 rev

MRI NO2 Nitric Oxide Booster 3000mg L-Arginine & AAKG (180 Caplets)
MRI$45.144.2★254 rev
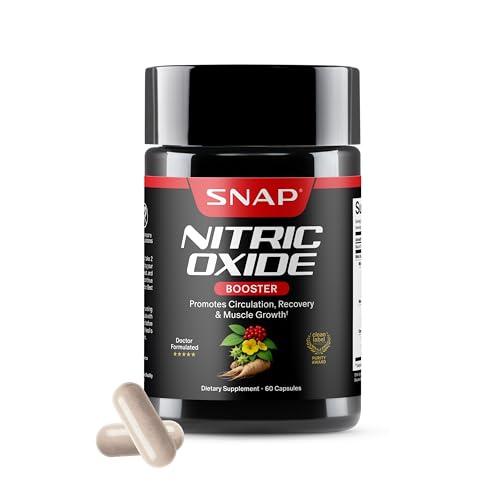
Snap Supplements Nitric Oxide Booster for Men & Women L-Citrulline + 3 Forms of L-Arginine for Stamina Endurance Circulation & Energy Support * Caffeine-Free Pre-Workout Alternative 60 Capsules
Snap Supplements$24.824.3★18,943 rev
Newest
by launch date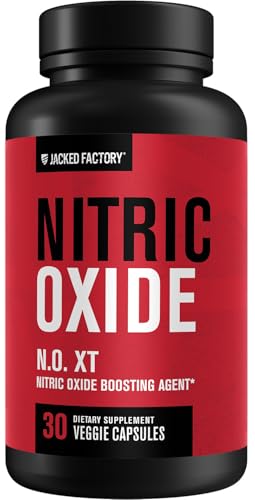
Jacked Factory N.O. XT Nitric Oxide Supplements for Men w/Nitrosigine L Arginine L Citrulline Supplement for Muscle Pumps & Vascularity - Pre Workout Nitric Oxide Booster & Muscle Builder - 30 Caps
Jacked Factory$9.6515,564 rev
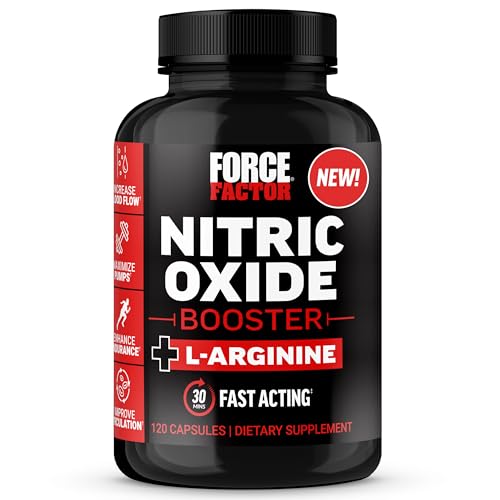
Force Factor Nitric Oxide Booster Fast-Acting Formula with L-Arginine Boosts Nitric Oxide Levels Maximize Muscle Pumps Enhance Endurance Improve Circulation 120 Capsules
Force Factor$26.091,374 rev

Micro Ingredients Nitric Oxide Supplement for Men & Women 3 600mg Per Serving 240 Bisected Tablets | L-Arginine + L-Citrulline Amino Acid Complex | Pre-Workout Caffeine-Free | Non-GMO Gluten Free
Micro Ingredients$21.47809 rev

NO2U Bryan Nitriceuticals Nitric Oxide Supplement 60 Count 30 Day Supply
NO2U$56.02337 rev
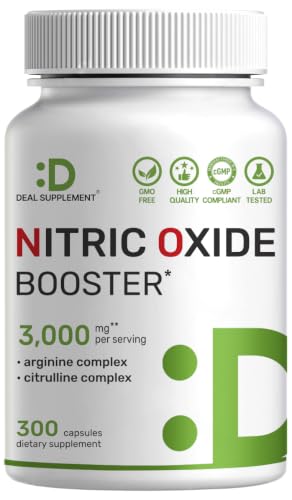
Nitric Oxide Supplement 3 000mg 300 Capsules | 12-in-1 Complex for Men & Women Arginine Citrulline Korean Red Ginseng Tongkat Ali Maca Root & Marshmallow Blend*
DEAL SUPPLEMENT$18.682,070 rev
Trending
90-day click momentumJacked Factory N.O. XT Nitric Oxide Supplements for Men w/Nitrosigine L Arginine L Citrulline Supplement for Muscle Pumps & Vascularity - Pre Workout Nitric Oxide Booster & Muscle Builder - 30 Caps
Jacked Factory$9.654.3★
Micro Ingredients Nitric Oxide Supplement for Men & Women 3 600mg Per Serving 240 Bisected Tablets | L-Arginine + L-Citrulline Amino Acid Complex | Pre-Workout Caffeine-Free | Non-GMO Gluten Free
Micro Ingredients$21.474.4★
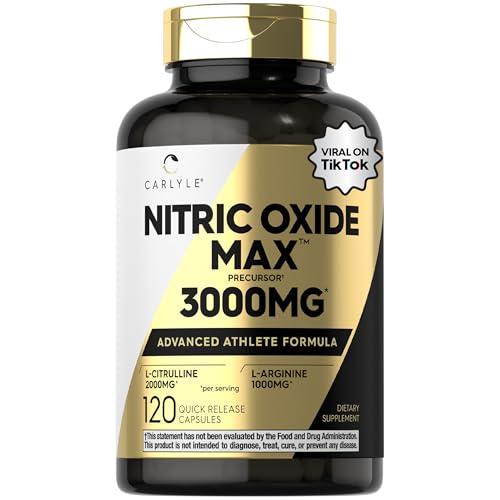
Carlyle Nitric Oxide Supplement 3000mg | 120 Capsules | with L-Arginine & L-Citrulline | for Men & Women | Pre & Post Workout | Non-GMO Gluten Free
Carlyle$10.104.4★
MRI NO2 Nitric Oxide Booster 3000mg L-Arginine & AAKG (180 Caplets)
MRI$45.144.2★
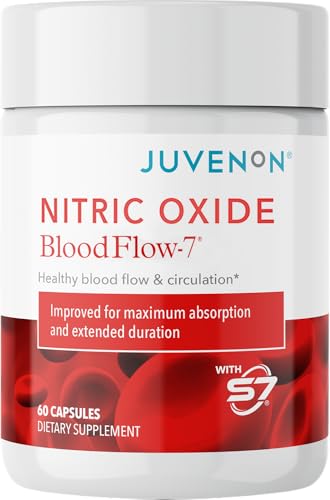
Juvenon BloodFlow-7 Nitric Oxide Supplements for Men & Women - Natural Nitric Oxide Booster with Nitrosigine + S7 - Blood Flow & Circulation Support (1-Pack)
Juvenon$42.014.4★
Demand & seasonality
Weekly Amazon search volume, last 103 weeks — -7.2% search growth over the last 90 days.Peak months: Aug, Sep · busiest ÷ quietest = 19.2×
Reviews
What buyers praise and complain about, mined from review topics.What buyers love
“Excellent product”
“helps with energy”
“Helps with blood pressure”
“found them to be highly effective”
“True to picture”
“Good deal”
“Love this vitamin”
“Great for heart & artery health”
“No side effects”
“I recommend it for those that get muscle stiffness”
What buyers complain about
“Not effective”
“There isnt enough actual product in the serving dose to be effective”
“the side effects have been too harsh for me”
“to expensive”
“the capsules are small”
“I cant say that it has done anything for my blood pressure”
“This doesn't work as advertised”
“Trouble swallowing it”
“Snap supplements overall are not good for u”
“nor energy level”