no seed oil snacks
Launch it74/100no seed oil snacks clears our launch bar: a $12.9M/yr market growing +90.8% with returns at 0.0%.
Market/yr
$12.9M
Growth (1y)
+90.8%
Products
41
Brands
4
was 5 a year ago
Sellers
679
Price range
$6.83–$50.08
Returns
0.0%
Rating
4.5★
Launch it
Scored 74/100 across market size, growth, competition, quality gap, and returns.
Demand
Weekly Amazon search volume, last 104 weeks — +90.8% year over year.Seasonality
Monthly demand index across the year — 1.00 is average.No pronounced peak months · busiest ÷ quietest = 1.5×
Competition
- RXBAR56%
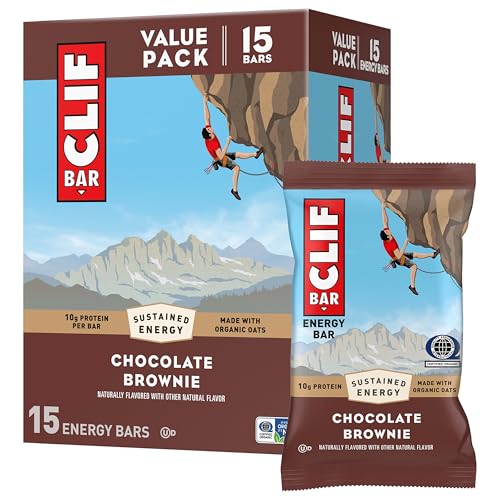
- CLIF Bar36%
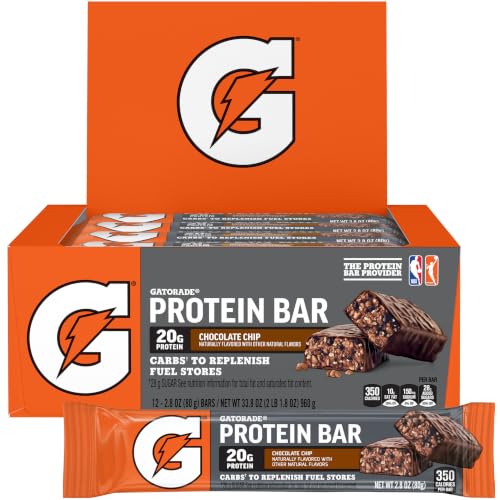
- Gatorade7%
- CLIF BUILDER'S1%
Clicks spread well past the top 5 (36% combined) — an open shelf where new products get seen. 4 brands and 679 sellers compete here.
Brands
4 falling
was 5 a year ago
Sellers
679
Top 5 brand share
100%
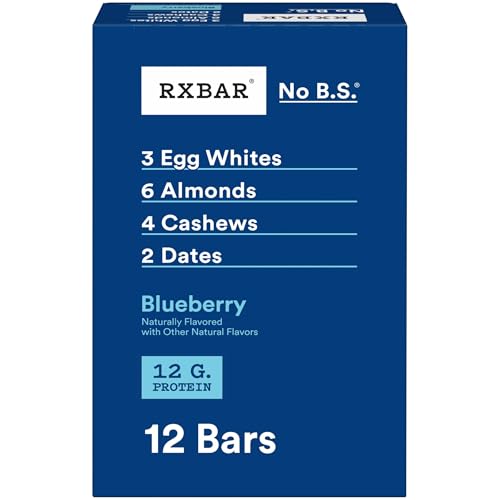

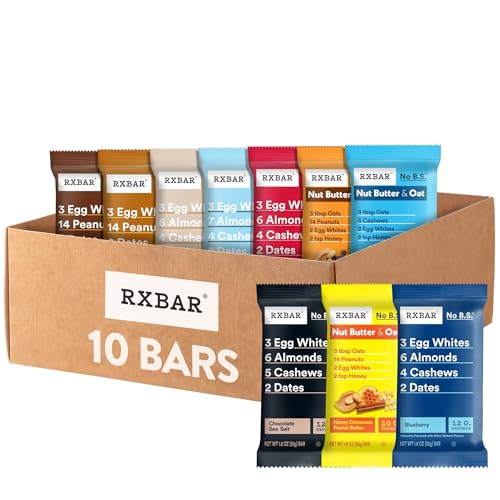
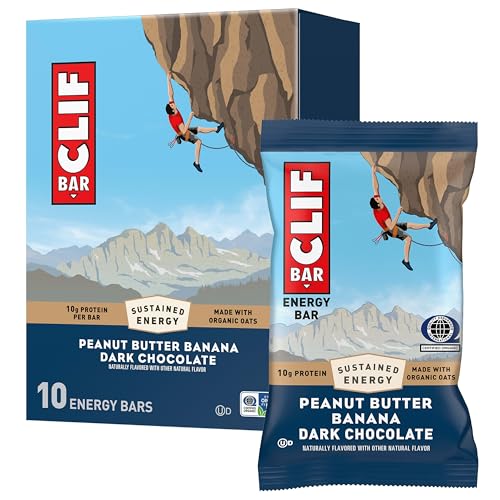
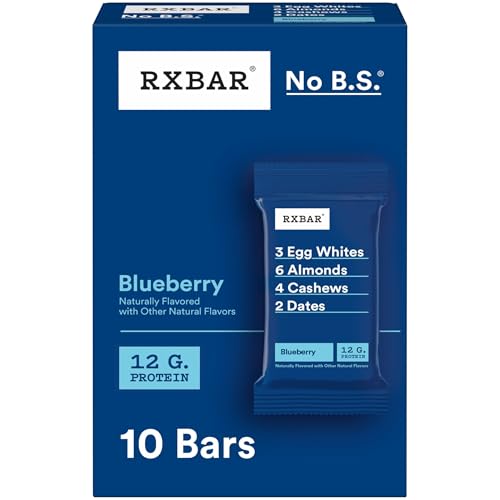
Product shelf
All 41 tracked products in this niche.
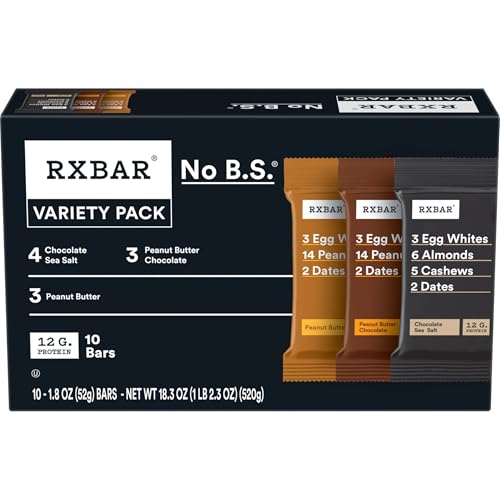
RXBAR Protein Bars 12g Protein Gluten Free Snacks 3-Flavor Variety Pack 18.3oz Box (10 Bars)
RXBAR
$16.624.4★1,162 reviews

RXBAR Protein Bars 12g Protein Gluten Free Snacks Chocolate Sea Salt 18.3oz Box (10 Bars)
RXBAR
$16.424.4★12,076 reviews
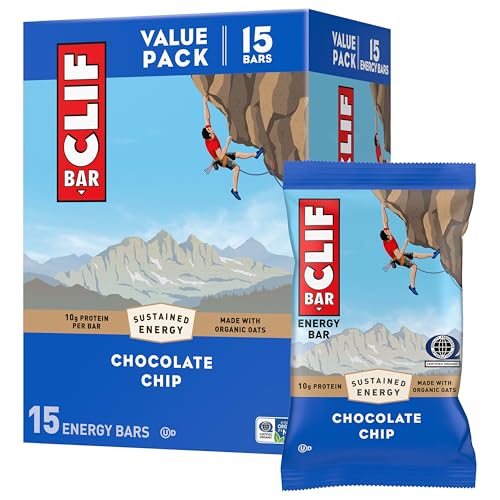
CLIF BAR - Energy Protein Bars - Chocolate Chip - Made with Organic Oats - Energy Bars - Non-GMO - (15 Pack)
CLIF Bar
$16.224.7★1,635 reviews
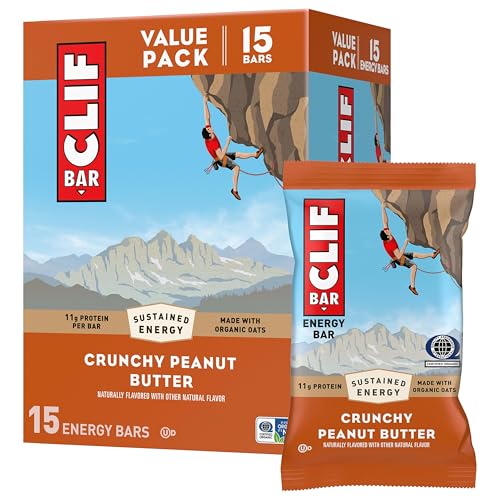
CLIF BAR - Energy Protein Bars - Crunchy Peanut Butter - Made with Organic Oats - Energy Bars - Non-GMO - (15 Pack)
CLIF Bar
$16.084.8★2,531 reviews
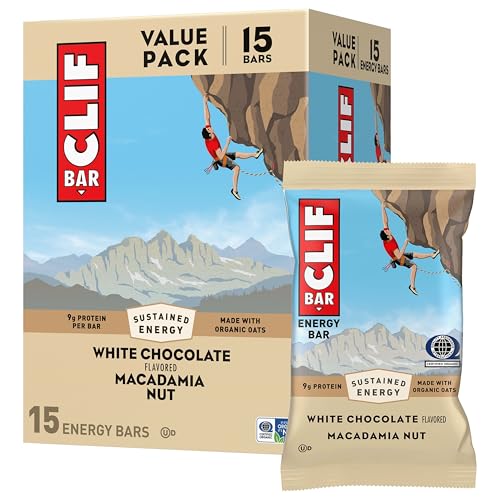
CLIF BAR - Energy Protein Bars - White Chocolate Macadamia Nut - Made with Organic Oats - Energy Bars - Non-GMO - (15 Pack)
CLIF Bar
$15.924.7★1,530 reviews
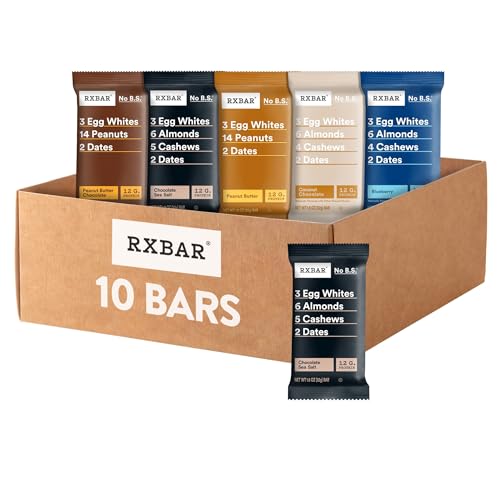
RXBAR Protein Bars 12g Protein Gluten Free Snacks 5-Flavor Variety Pack (10 Bars)
RXBAR
$16.504.3★296 reviews
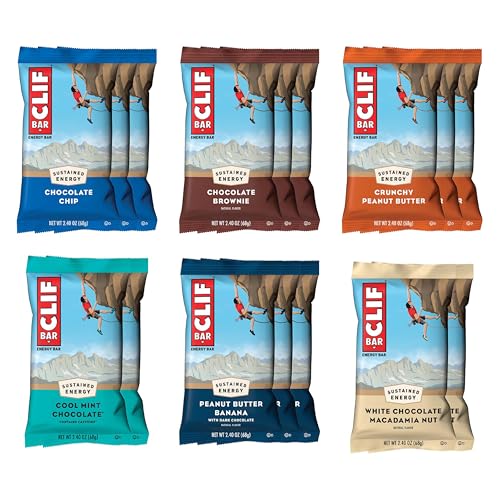
CLIF BAR - Energy Protein Bars - Variety Pack - 6 Flavors - Made with Organic Oats - Energy Bars - Non-GMO - (16 Pack)
CLIF Bar
$21.744.5★471 reviews

RXBAR Nut Butter and Oat Protein Bars Protein Snacks Snack Bars Honey Cinnamon Peanut Butter 23.2oz Box (12 Bars)
RXBAR
$19.934.6★1,481 reviews
Reviews
What buyers praise and complain about, mined from review topics.What buyers love
“Delicious bars”
“Exceptional nutrition”
“Good vanilla flavor”
“Good value for money”
“Good Quality”
“Very healthy”
“Love the ingredients”
“it improves your energy level”
“Great sweet tooth snack”
“easy to eat”
What buyers complain about
“Not tasty”
“Not high protein”
“Too expensive”
“waaaayyyyyyy too much sugar”
“the weird flavor”
“difficult to chew”
“the bars were very dried out”
“Hard pieces in it”
“Horrible Texture”
“they taste stale”
Top return reasons
- Taste-Overall19%
- Flavor18%
- Stale/Rotten/Spoiled8%
- Value For Money8%
- Hard Feel7%
- Storage Temperature5%
- Advertised Vs Actual Product3%
- Sweetness3%
- Size-Overall3%
- Ease Of Chewing/Swallowing2%