no calorie snacks
Skip it36/100a small market ($15K/yr) — no calorie snacks doesn't clear our bar today.
Market/yr
$15K
Growth (1y)
+68.8%
Products
12
Brands
5
was 3 a year ago
Sellers
56
Price range
$5.31–$25.70
Returns
0.0%
Rating
4.5★
Skip it
Scored 36/100 across market size, growth, competition, quality gap, and returns.
Demand
Weekly Amazon search volume, last 104 weeks — +68.8% year over year.Seasonality
Monthly demand index across the year — 1.00 is average.Peak months: Jul, Aug, Sep · busiest ÷ quietest = 3.2×
Competition
- Atkins80%
- Kellogg's Special K9%
- Fiber One4%
- Protein One4%
- Quest3%
- Other0%
The top 5 products capture 74% of clicks — a locked-up shelf that new listings rarely crack. 5 brands and 56 sellers compete here.
Brands
5 rising
was 3 a year ago
Sellers
56
Top 5 brand share
100%
 Atkins Peanut Butter Protein Wafer Crisps Protein Dessert 4g Net Carb 1g Sugar Keto Friendly 5 Count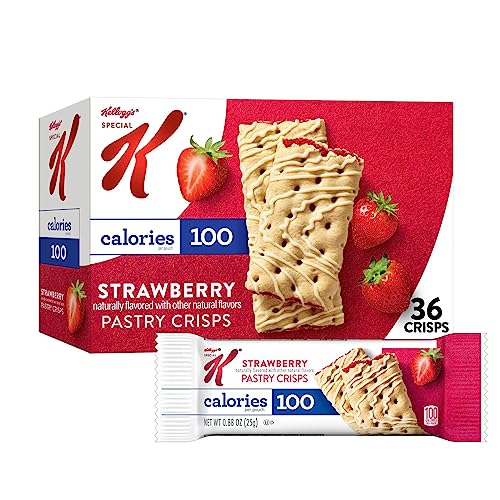

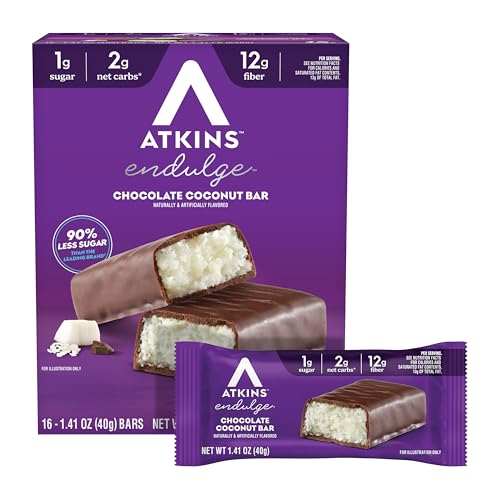
Product shelf
All 12 tracked products in this niche.
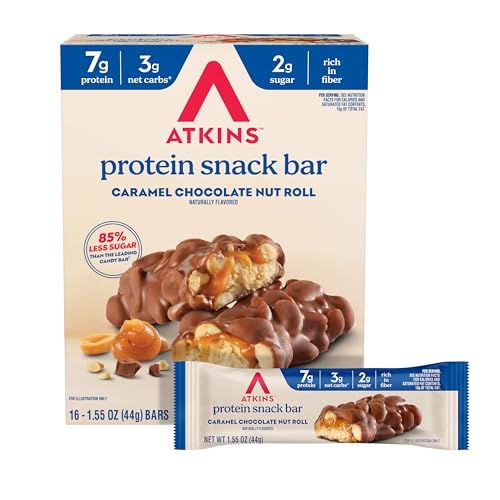
Atkins Caramel Chocolate Nut Roll Snack Bar Protein Snack 7g Protein 2g Sugar High Fiber Snack 16 Count
Atkins
$20.714.7★3,263 reviews
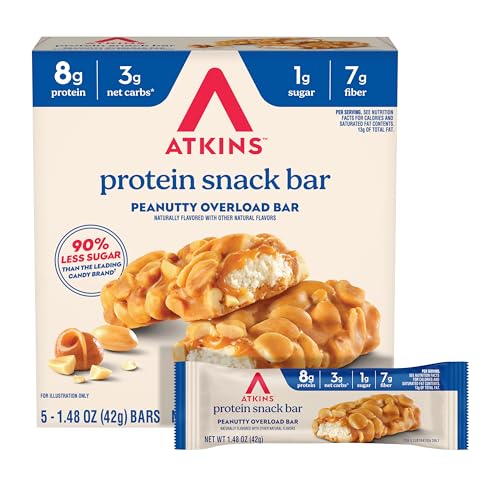
Atkins Peanutty Overload Snack Bar Protein Snack High in Fiber 2g Sugar 5 Count
Atkins
$7.104.6★311 reviews
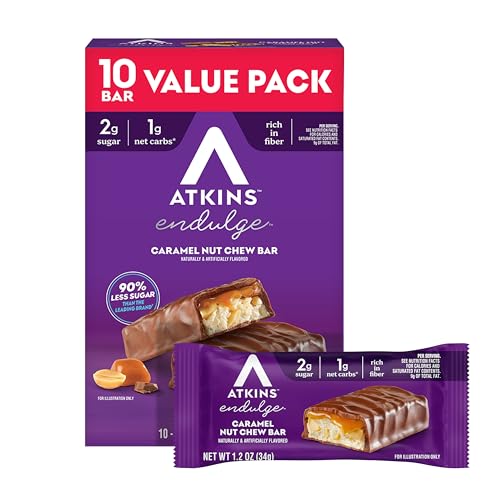
Atkins Endulge Caramel Nut Chew Bar Low Sugar Snack Dessert Bar High Fiber Bar 1g Sugar 10 Count
Atkins
$10.464.6★12,262 reviews
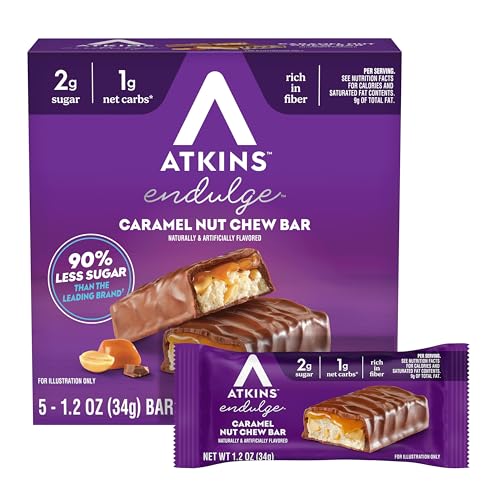
Atkins Endulge Caramel Nut Chew Bar Dessert Favorite 1g Sugar Good Source of Fiber 5 Count
Atkins
$6.504.6★4,926 reviews
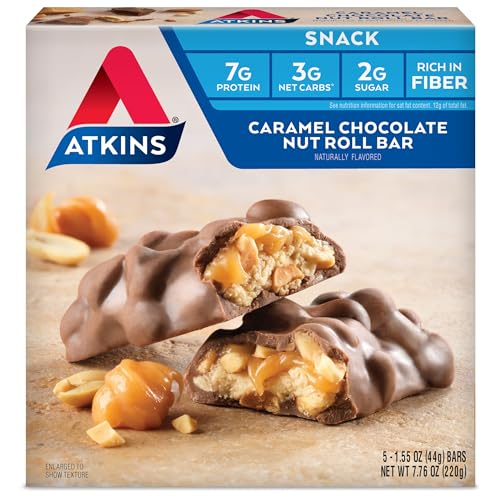
Atkins Caramel Chocolate Nut Roll Snack Bar Protein Snack High in Fiber 2g Sugar 5 Count
Atkins
$7.174.7★14,191 reviews

Special K Bar Protein Meal Bars 12g Protein Snacks Meal Replacement 3-Flavor Variety Pack (3 Boxes 18 Bars)
Kellogg's Special K
$25.704.5★2,713 reviews
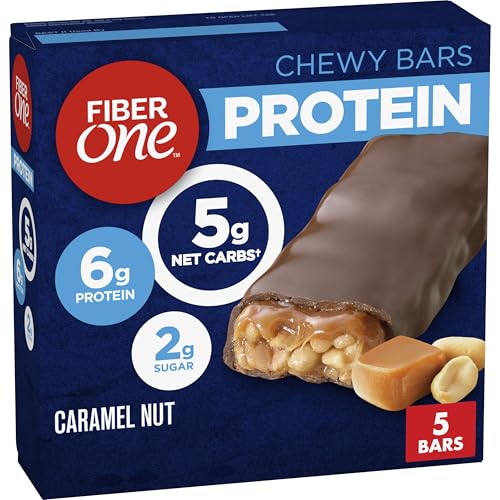
Fiber One Chewy Protein Bars Caramel Nut Protein Snacks 1.17 oz 5 ct
Fiber One
$5.314.5★8,229 reviews

Protein One Strawberries and Cream Protein Bars GLP-1 Friendly 5 Ct 4.8 oz
Protein One
$5.573.6★2,355 reviews
Reviews
What buyers praise and complain about, mined from review topics.What buyers love
“Absolutely Delicious”
“Great protein bars”
“Excellent flavor”
“they make a good sweet treat”
“Great quality for the price - fast shipping”
“Great Deal”
“Diabetic friendly”
“Crispy, light and delicious”
“perfect size”
“Healthy Poptart”
What buyers complain about
“Not tasty”
“Waste of Money”
“Question nutrition bars are nasty”
“Not Great Flavor”
“Texture is gross”
“Too sweet”
“Bars are getting smaller”
“Low quality product”
“A little chewy”
“Okay so the picture is definitely deceiving”
Top return reasons
- Taste-Overall24%
- Ingredients-Overall15%
- Flavor12%
- Nutritional Content10%
- Value For Money6%
- Sweetness4%
- Size-Overall4%
- Advertised Vs Actual Product4%
- Stale/Rotten/Spoiled3%
- Moist/Dry3%