muscle soreness relief
Worth a lookShows low returns (0.3%), but brand-locked demand (top 5 brands take 98% of clicks) keeps it on the watch list.
Returns
Incredible0.3%return rate — above 6% kills the launch gate
Conversion
Incredible13.6%search→purchase rate — share of searches ending in a sale
Market size
Incredible$2.3M$2.3M/yr · 1.1M searches
Avg price
Great$16.36avg listing price — sweet spot $15–$100
Price range
Great$6.76–$39.79cheapest to priciest tracked listing — scored on the share inside $15–$100
Quality gap
Good4.5★avg incumbent rating — lower means beatable quality
Growth
Bad-0.6%90-day search growth — must beat 0% to launch
Competition
Bad76%top-5 click share — a locked-up shelf
Review moat
Bad12,606.64avg incumbent reviews — the moat a new listing must climb
Brand share
Bad98%top-5 brand share — brand-locked demand
Competition
The top 5 products capture 76% of clicks — a locked-up shelf that new listings rarely crack.Brands
6 falling
Sellers
575
Top-5 brand share
98%
Open market
0%
- Boiron70%
- VitaMedica15%
- Real Relief8%
- PHARMBANNER3%
- Redcool2%
- Miracle Plus2%
- Open — no brand owns it (0%)
Product shelf
Each bubble is one product — market share against review moat; bubble size tracks estimated sales, color grades how beatable the incumbent looks.
All 11 tracked products in this niche — three views at once, no toggling.
Top sellers
by 90-day click share
Boiron Arnicare Cream for Joint Pain Muscle Pain Swelling Soreness Stiffness and Bruises - Fast Absorbing and Fragrance-Free - 4.2 oz
Boiron$13.144.6★17,524 rev
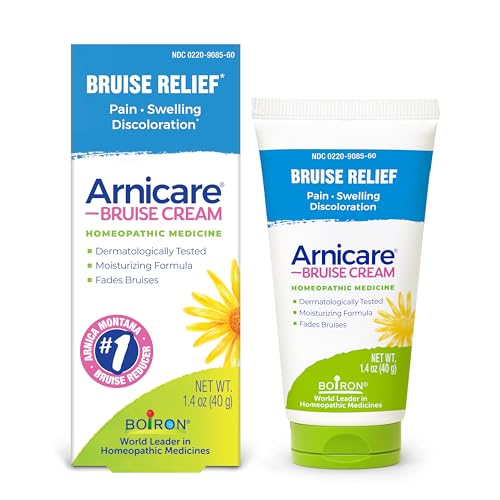
Boiron Arnicare Bruise Cream for Pain Relief from Bruising and Swelling or Discoloration from Injury - 1.4 oz
Boiron$7.484.6★6,974 rev

VitaMedica Arnica Gel Plus 15 Healing Plant Compounds Extra Strength Formula for Bruising All-Natural Plant-Based Topical Gel
VitaMedica$19.924.6★3,268 rev

Real Relief Arnica Cream Natural Non-Greasy Hypoallergenic and Unscented 4 oz (Pack of 1)
Real Relief$9.784.5★5,715 rev
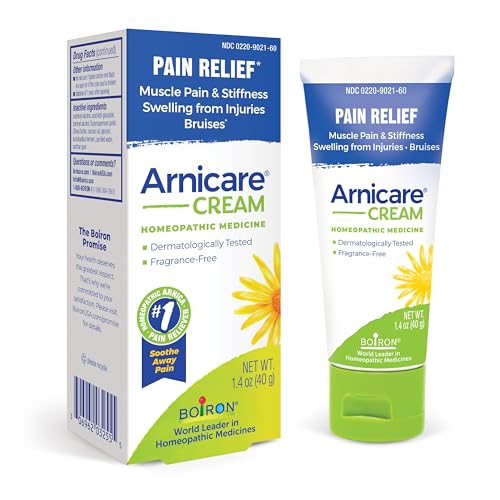
Boiron Arnicare Cream Homeopathic Medicine for Pain Relief 1.3 Ounce (Pack of 1)
Boiron$6.764.6★17,524 rev
Newest
by launch date
PHARMBANNER Arnica Bruise Cream Extra Strength Fast-Acting Arnica Montana with Vitamins K C & E for Bruising Swelling Discoloration & Thin Skin Hydrating Moisturizer for Face & Body 4 oz
PHARMBANNER$22.90148 rev
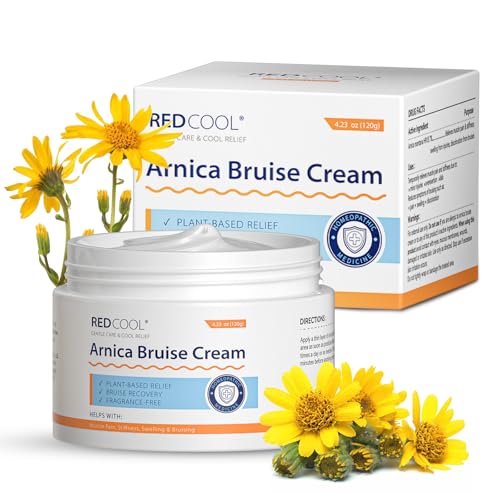
Redcool
Redcool$39.7915 rev
VitaMedica Arnica Gel Plus 15 Healing Plant Compounds Extra Strength Formula for Bruising All-Natural Plant-Based Topical Gel
VitaMedica$19.923,268 rev
Boiron Arnicare Bruise Cream for Pain Relief from Bruising and Swelling or Discoloration from Injury - 1.4 oz
Boiron$7.486,974 rev
Real Relief Arnica Cream Natural Non-Greasy Hypoallergenic and Unscented 4 oz (Pack of 1)
Real Relief$9.785,715 rev
Trending
90-day click momentumPHARMBANNER Arnica Bruise Cream Extra Strength Fast-Acting Arnica Montana with Vitamins K C & E for Bruising Swelling Discoloration & Thin Skin Hydrating Moisturizer for Face & Body 4 oz
PHARMBANNER$22.904.3★
Redcool
Redcool$39.793.8★

Boiron Arnicare Cream Natural Soothing Relief for Joint Pain Muscle Pain Swelling Soreness and Stiffness - Fast Absorbing and Fragrance-Free - 2.5 oz
Boiron$8.224.6★
Boiron Arnicare Cream Homeopathic Medicine for Pain Relief 1.3 Ounce (Pack of 1)
Boiron$6.764.6★
Real Relief Arnica Cream Natural Non-Greasy Hypoallergenic and Unscented 4 oz (Pack of 1)
Real Relief$9.784.5★
Demand & seasonality
Weekly Amazon search volume, last 104 weeks — -0.6% search growth over the last 90 days.Peak months: Jun, Jul · busiest ÷ quietest = 1.9×
Reviews
What buyers praise and complain about, mined from review topics.What buyers love
“does the job”
“Overall, its an effective and reliable product that I would definitely recommend”
“It works wonderfully to ease joint discomfort”
“Good price”
“absorbs well”
“Natural pain and inflammation remedy”
“clean scent”
“Great on sore muscles”
“As advertised”
“Easy to open”
What buyers complain about
“DIDN'T WORK FOR ME”
“No pain relief”
“Makes me itch”
“NOT fragrance free”
“Waste of money”
“Were the ingredients changed”
“purple colors were faded”
“not only did it keep the swelling down”
“Junk”
“still have no relief from joint pain in my feet”