manuka oil
Worth a lookShows demand growing +187.1% this quarter, but a failed launch gate (market size, growth, or returns) keeps it on the watch list.
Growth
Incredible+187.1%90-day search growth — must beat 0% to launch
Returns
Great1.0%return rate — above 6% kills the launch gate
Avg price
Great$22.58avg listing price — sweet spot $15–$100
Price range
Great$9.68–$57.70cheapest to priciest tracked listing — scored on the share inside $15–$100
Conversion
Good6.8%search→purchase rate — share of searches ending in a sale
Brand share
Good72%top-5 brand share — brands hold most of the demand
Review moat
Okay1,591.2avg incumbent reviews — the moat a new listing must climb
Quality gap
Okay4.5★avg incumbent rating — lower means beatable quality
Competition
Okay65%top-5 click share — leaders hold, buyers still browse
Market size
Okay$107K$107K/yr · 69K searches
Competition
The top 5 products take 65% of clicks — established leaders, but buyers still shop beyond them.Brands
16 rising
Sellers
30
Top-5 brand share
72%
Open market
22%
- NZ Country Manuka21%
- Botanical Beauty19%
- TODICAMP14%
- EUQEE11%
- SVA ORGANICS8%
- PUR3606%
Product shelf
Each bubble is one product — market share against review moat; bubble size tracks estimated sales, color grades how beatable the incumbent looks.
All 20 tracked products in this niche — three views at once, no toggling.
Top sellers
by 90-day click share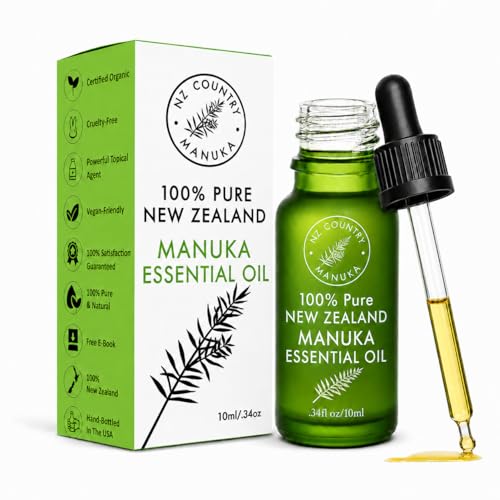
100% Pure New Zealand Manuka Oil | Organic Essential Oil | 35x Stronger Than Tea Tree | Natural Skin Care | Toenail Treatment | Diffuser | Aromatherapy | Nails | Hair | Skin | Lips
NZ Country Manuka$24.894.4★4,212 rev
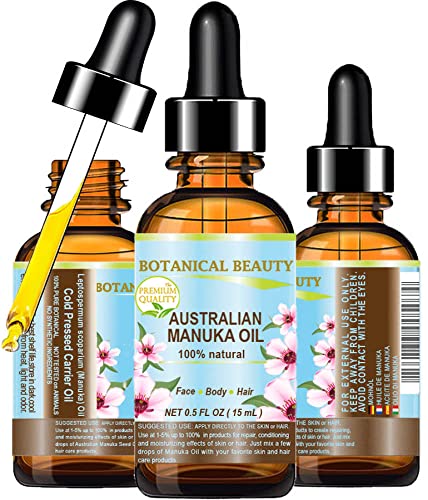
Botanical Beauty MANUKA OIL WILD GROWTH RAW 100% Natural VIRGIN UNREFINED Cold Pressed Carrier Oil. for Skin Face Hair Lip and Nail Care Anti-Aging 0.5 Fl.oz.- 15 ml
Botanical Beauty$15.144.4★187 rev
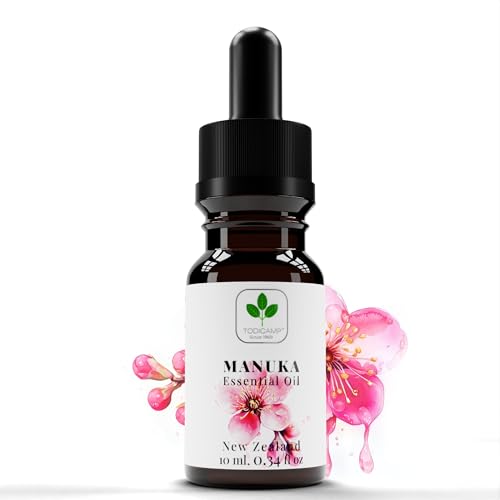
TODICAMP 100% Pure Manuka Oil from New Zealand | Therapeutic-Grade Essential Oil for Wound Care Skin Soothing Nail & Scalp Health
TODICAMP$18.034.4★76 rev
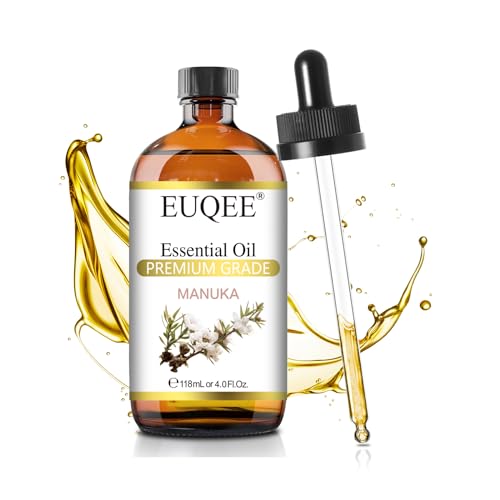
EUQEE Manuka Essential Oil 118ml Large Capacity Pure Manuka Oil with Glass Dropper for Skin Diffuser Aromatherapy Cleaning Soap Candle Making - 4Fl.Oz
EUQEE$9.684.3★6,095 rev
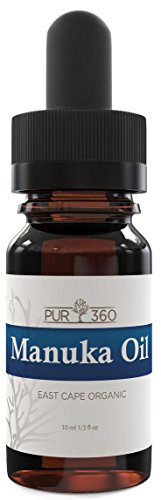
PUR360 Manuka Oil - 33x More Powerful Than Tea Tree Oil - Best Treatment for Toenails Acne Irritated Skin Feet and more
PUR360$21.624.3★2,324 rev
Newest
by launch date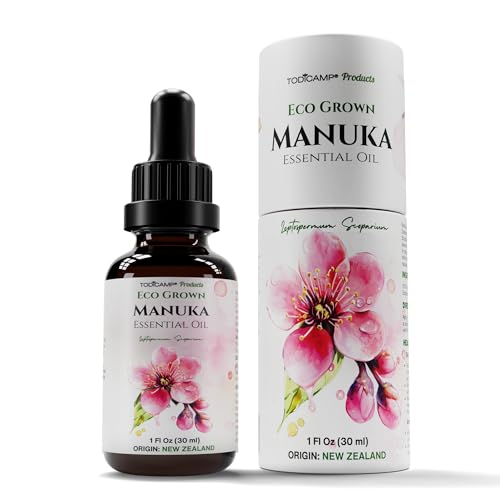
TODICAMP 100% Pure Manuka Oil from New Zealand | Therapeutic-Grade Essential Oil for Wound Care Skin Soothing Nail & Scalp Health
TODICAMP$37.1276 rev
TODICAMP 100% Pure Manuka Oil from New Zealand | Therapeutic-Grade Essential Oil for Wound Care Skin Soothing Nail & Scalp Health
TODICAMP$18.0376 rev
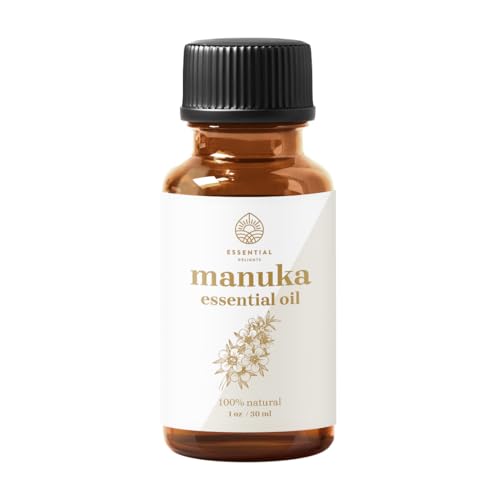
Manuka Oil by Essential Delights - Premium Essential Oil | for Skin Face Body Hair Revitalization (1 Fl.Oz)
Essential Delights$17.1511 rev
EUQEE Manuka Essential Oil 118ml Large Capacity Pure Manuka Oil with Glass Dropper for Skin Diffuser Aromatherapy Cleaning Soap Candle Making - 4Fl.Oz
EUQEE$9.686,095 rev
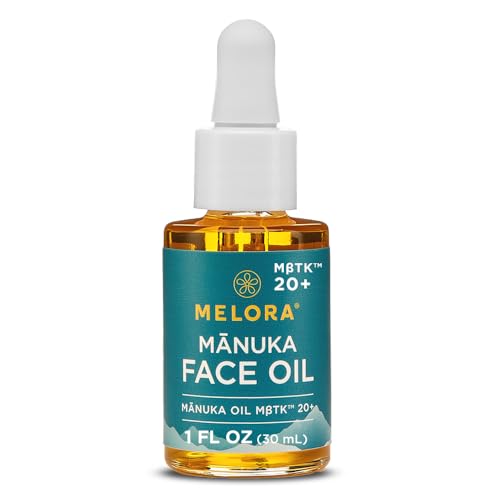
MELORA Manuka Face Oil (1 Oz) - Manuka Skin Care Facial Oil Serum for Dry or Sensitive Skin Anti-Aging Oil for Face for Women & Men
MELORA$19.9756 rev
Trending
90-day click momentum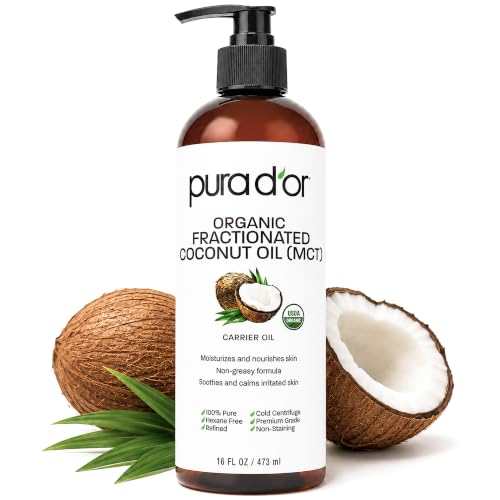
PURA DOR ORGANIC Fractionated Coconut Oil MCT Oil (16 Oz) 100% Pure & Natural USDA Certified
PURA D'OR$14.744.5★
TODICAMP 100% Pure Manuka Oil from New Zealand | Therapeutic-Grade Essential Oil for Wound Care Skin Soothing Nail & Scalp Health
TODICAMP$37.124.4★
Botanical Beauty MANUKA OIL WILD GROWTH RAW 100% Natural VIRGIN UNREFINED Cold Pressed Carrier Oil. for Skin Face Hair Lip and Nail Care Anti-Aging 0.5 Fl.oz.- 15 ml
Botanical Beauty$15.144.4★
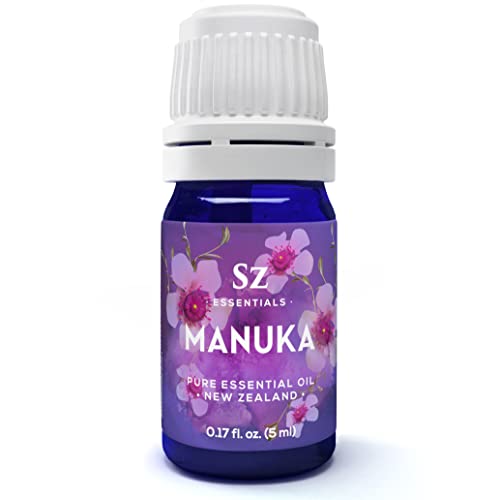
Sz Essentials - Manuka Essential Oil - New Zealand - 100% Pure and Natural Undiluted - Promotes Natural Solution for Relaxation with Soothing Fresh and Earthy Aroma - 0.17 fl oz (5ml)
Sz Essentials$15.954.3★
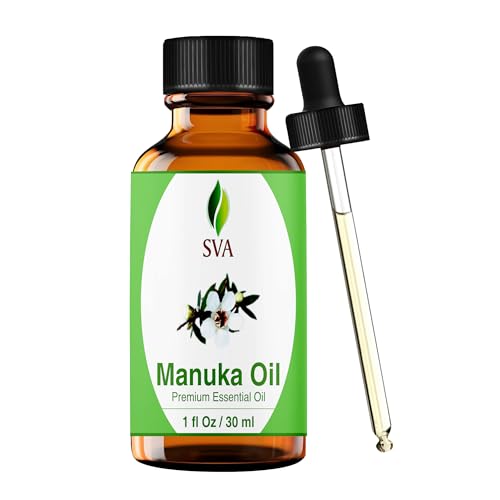
SVA Manuka Essential Oil 1 Fl Oz for Diffuser Skin & Hair Care Ideal for Massage & DIY Blends with Dropper
SVA ORGANICS$39.334.6★
Demand & seasonality
Weekly Amazon search volume, last 104 weeks — +187.1% search growth over the last 90 days.Peak months: Apr, May · busiest ÷ quietest = 3.5×
Reviews
What buyers praise and complain about, mined from review topics.What buyers love
“But I have no complaints about it because it does exactly what it's advertised to do”
“The scent is strong”
“Very moisturizing”
“I love how it makes my skin feel”
“Keeps my skin very soft”
“Product as advertised”
“absorbs well”
“Very good oil”
“Although this is an oil it soaks in the skin well”
“Very good for dry skin”
What buyers complain about
“Bad smell”
“It makes sense that they leaked”
“That also explains the cheap price”
“However the cap does not fit the bottle”
“The pump on the bottle would not release to open”
“It is poor quality control on their part”
“It dried up, I think, because of the child-proof bottle closure and maybe how the squeeze top is attached to the cap”
“It does kind of have an oily feel going on”
“False advertising; blended with oregano oil”
“I got that horrible tingling feeling on my bottom lip”