lidocaine patches 5%
Worth a lookShows low returns (0.1%), but a failed launch gate (market size, growth, or returns) keeps it on the watch list.
Returns
Incredible0.1%return rate — above 6% kills the launch gate
Avg price
Great$20.05avg listing price — sweet spot $15–$100
Quality gap
Great4.3★avg incumbent rating — lower means beatable quality
Price range
Good$5.27–$37.06cheapest to priciest tracked listing — scored on the share inside $15–$100
Conversion
Good6.0%search→purchase rate — share of searches ending in a sale
Competition
Good49%top-5 click share — leaders hold, buyers still browse
Growth
Good+22.4%90-day search growth — must beat 0% to launch
Brand share
Good74%top-5 brand share — brands hold most of the demand
Market size
Okay$163K$163K/yr · 135K searches
Review moat
Bad4,137.44avg incumbent reviews — the moat a new listing must climb
Competition
The top 5 products take 49% of clicks — established leaders, but buyers still shop beyond them.Brands
12 falling
Sellers
82
Top-5 brand share
74%
Open market
20%
- Aspercreme28%
- CARELAND15%
- Sumifun14%
- WELMATE9%
- Amazon Basic Care9%
- Salonpas6%
Product shelf
Each bubble is one product — market share against review moat; bubble size tracks estimated sales, color grades how beatable the incumbent looks.
All 25 tracked products in this niche — three views at once, no toggling.
Top sellers
by 90-day click share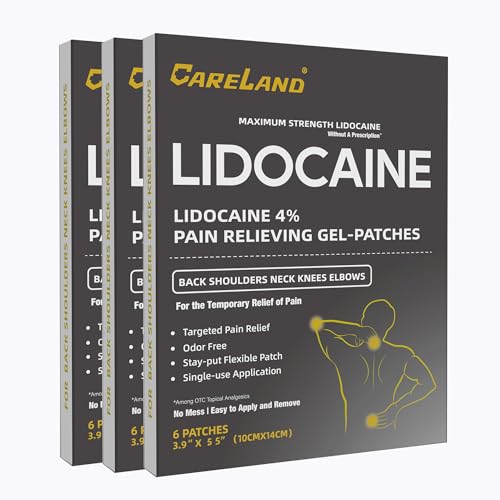
CARELAND Lidocaine Gel Patch 18 Count Maximum Strength Pain Patches for Muscle Relief in Neck Knee Back and Shoulders Unscented Numbing Patch for Soothing Nerves Joints
CARELAND$15.144.1★4,454 rev

Aspercreme Max Strength Lidocaine Pain Relief Patch (5 Count) for Back Pain Odor Free Pain Patches
Aspercreme$8.704.4★8,912 rev

Sumifun 4% Lidocaine Pain Relief Patches 30 Count Maximum Strength Numbing Gel Patch for Back Knee Neck Joint Ache Muscle Soreness Topical Analgesic
Sumifun$32.184.3★5,116 rev

Amazon Basic Care Maximum Strength OTC Pain Relief 4% Lidocaine Patch 3.9 x 5.5 15-Count Box (Previously HealthWise)
Amazon Basic Care$14.924.3★9,172 rev
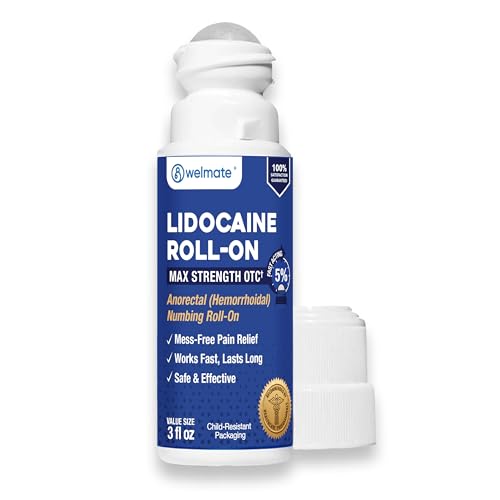
WELMATE 5% Lidocaine Roll On Maximum Strength Pain Relief 3 oz - No Mess Topical Anesthetic - Hemorrhoid Relief - Non-Greasy Fast Acting & Long Lasting - Numbing Roll-On
WELMATE$22.254.4★796 rev
Newest
by launch date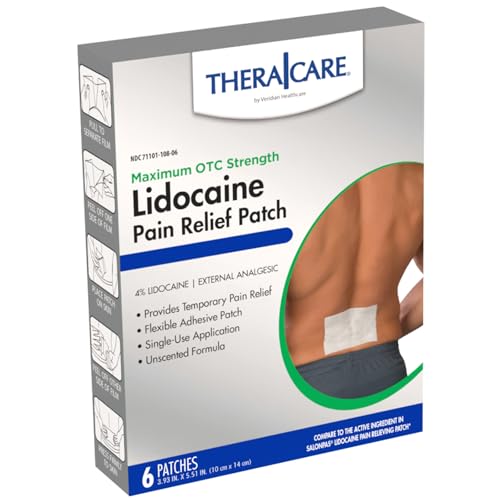
Thera|Care Maximum Strength OTC Pain Relief Patch | 4% Lidocaine Patch | 3.9 x 5.5 | 6-Count Box
Thera Care$5.952,438 rev
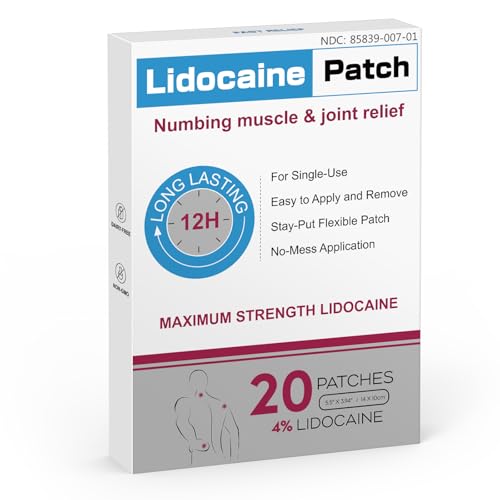
Teemofe Lidocaine Pain Relief Patch | Maximum Strength Pain Patches for Muscle Relief in Neck Knee Back and Shoulders |12 Hour Long Lasting Relief Pains | 20 Count-568
Teemofe$20.9347 rev

Aspercreme Lidocaine Pain Relief Patch XL for Back Neck & Shoulder Pain Topical Patches with Max-Strength 4% Lidocaine & Flexible Fabric Numbs Away Pain 4 Ct. 3 Pack
Aspercreme$28.8221 rev
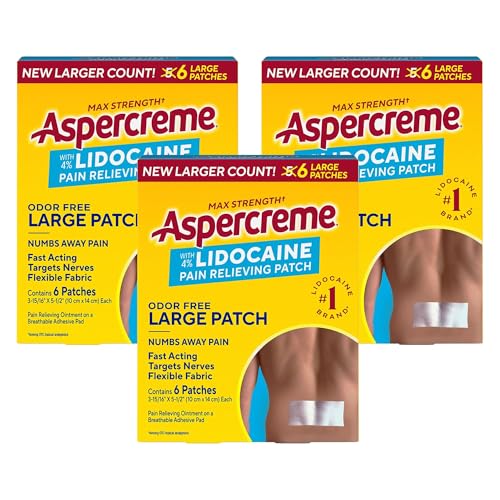
Aspercreme Lidocaine Pain Relief Patch for Back Neck & Shoulder Pain Topical Patches with Max-Strength 4% Lidocaine & Flexible Fabric Numbs Away Pain 6 Ct. 3 Pack
Aspercreme$37.065 rev
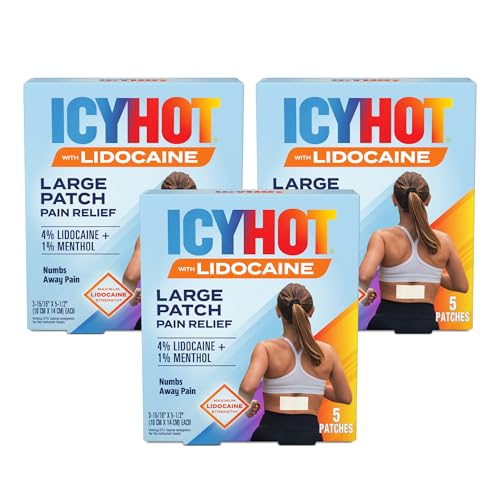
Icy Hot Max Strength Lidocaine Pain Relief Patch (5 Count) Penetrates for Fast Targeted Relief 3 pk
Icy Hot$28.0819,308 rev
Trending
90-day click momentumAspercreme Lidocaine Pain Relief Patch for Back Neck & Shoulder Pain Topical Patches with Max-Strength 4% Lidocaine & Flexible Fabric Numbs Away Pain 6 Ct. 3 Pack
Aspercreme$37.064.8★
Thera|Care Maximum Strength OTC Pain Relief Patch | 4% Lidocaine Patch | 3.9 x 5.5 | 6-Count Box
Thera Care$5.954.3★
Aspercreme Lidocaine Pain Relief Patch XL for Back Neck & Shoulder Pain Topical Patches with Max-Strength 4% Lidocaine & Flexible Fabric Numbs Away Pain 4 Ct. 3 Pack
Aspercreme$28.824.4★
Teemofe Lidocaine Pain Relief Patch | Maximum Strength Pain Patches for Muscle Relief in Neck Knee Back and Shoulders |12 Hour Long Lasting Relief Pains | 20 Count-568
Teemofe$20.933.7★

Curist 5% Lidocaine Cream Pain Relief - Numb Quickly & Effectively with 5% Lidocaine Numbing Cream for Anorectal Use - (1 Pack - 2 oz Jar)
Curist$12.044.3★
Demand & seasonality
Weekly Amazon search volume, last 104 weeks — +22.4% search growth over the last 90 days.No pronounced peak months · busiest ÷ quietest = 1.3×
Reviews
What buyers praise and complain about, mined from review topics.What buyers love
“Works Well”
“Quality is solid”
“Not expensive”
“Works well for joint pain”
“Good adhesion”
“As advertised”
“Easy to peel”
“It was smooth to apply”
“Pretty good for muscle pain”
“They fit perfectly”
What buyers complain about
“Doesn't stay on”
“Did not work”
“No relief”
“They are expensive”
“It also has an odor that smells like mildew”
“Not good quality”
“Very difficult to put on”
“Container was smaller than I expected”
“dont last”
“I had a bad rash”