hyperice venom
Skip itA concentrated shelf (top 5 take 100% of clicks) — this niche doesn't clear our bar today.
Avg price
Great$86.78avg listing price — sweet spot $15–$100
Quality gap
Great4.2★avg incumbent rating — lower means beatable quality
Market size
Great$955K$955K/yr · 155K searches
Conversion
Great7.1%search→purchase rate — share of searches ending in a sale
Review moat
Good1,251.4avg incumbent reviews — the moat a new listing must climb
Returns
Okay3.9%return rate — above 6% kills the launch gate
Price range
Okay$14.99–$243.16cheapest to priciest tracked listing — scored on the share inside $15–$100
Growth
Bad-13.8%90-day search growth — must beat 0% to launch
Competition
Bad100%top-5 click share — a locked-up shelf
Brand share
Bad100%top-5 brand share — brand-locked demand
Competition
The top 5 products capture 100% of clicks — a locked-up shelf that new listings rarely crack.Brands
3 flat
Sellers
7
Top-5 brand share
100%
Open market
0%
- Hyperice81%
- Comfytemp15%
- Apriddeo4%
Product shelf
Each bubble is one product — market share against review moat; bubble size tracks estimated sales, color grades how beatable the incumbent looks.
All 5 tracked products in this niche — three views at once, no toggling.
Top sellers
by 90-day click share
Hyperice Venom 2 Back Wrap - Provides Advanced Heat and Vibration for Pain Soreness and Inflammation
Hyperice$243.164.5★952 rev

Comfytemp Wireless TENS Unit Machine for Pain Relief FSA Eligible TENS Unit Muscle Stimulator with 2 Sets 30 Modes HSA TENS Device for Back Rechargeable Portable with APP Control Fathers Day Gift
Comfytemp$36.194.3★1,213 rev
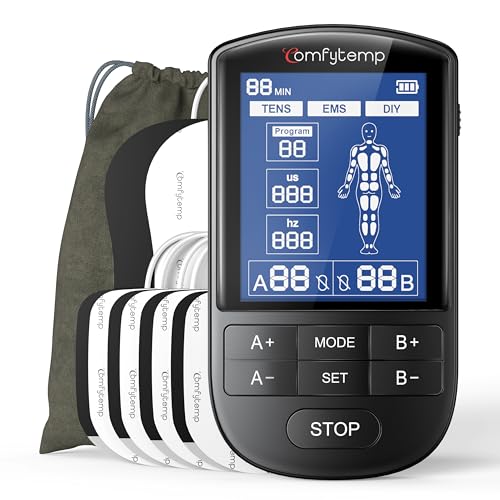
Comfytemp TENS Unit Muscle Stimulator for Pain Relief FSA Eligible TENS Machine - 20 Modes & DIY HSA Dual Channel EMS Unit for Back Neck Shoulder Electronic Pulse Massager Fathers Day Gift 10 Pads
Comfytemp$22.834.6★2,491 rev

Hyperice Venom Go - Advanced Heat + Vibration Wearable (Venom Go)
Hyperice$116.733.9★319 rev

Super Sticky Invisible Push up Self Adhesive Bra Backless Breast Lift Bra Reusable
Apriddeo$14.993.9★1,282 rev
Newest
by launch dateSuper Sticky Invisible Push up Self Adhesive Bra Backless Breast Lift Bra Reusable
Apriddeo$14.991,282 rev
Comfytemp Wireless TENS Unit Machine for Pain Relief FSA Eligible TENS Unit Muscle Stimulator with 2 Sets 30 Modes HSA TENS Device for Back Rechargeable Portable with APP Control Fathers Day Gift
Comfytemp$36.191,213 rev
Hyperice Venom 2 Back Wrap - Provides Advanced Heat and Vibration for Pain Soreness and Inflammation
Hyperice$243.16952 rev
Hyperice Venom Go - Advanced Heat + Vibration Wearable (Venom Go)
Hyperice$116.73319 rev
Comfytemp TENS Unit Muscle Stimulator for Pain Relief FSA Eligible TENS Machine - 20 Modes & DIY HSA Dual Channel EMS Unit for Back Neck Shoulder Electronic Pulse Massager Fathers Day Gift 10 Pads
Comfytemp$22.832,491 rev
Trending
90-day click momentumSuper Sticky Invisible Push up Self Adhesive Bra Backless Breast Lift Bra Reusable
Apriddeo$14.993.9★
Comfytemp Wireless TENS Unit Machine for Pain Relief FSA Eligible TENS Unit Muscle Stimulator with 2 Sets 30 Modes HSA TENS Device for Back Rechargeable Portable with APP Control Fathers Day Gift
Comfytemp$36.194.3★
Hyperice Venom 2 Back Wrap - Provides Advanced Heat and Vibration for Pain Soreness and Inflammation
Hyperice$243.164.5★
Comfytemp TENS Unit Muscle Stimulator for Pain Relief FSA Eligible TENS Machine - 20 Modes & DIY HSA Dual Channel EMS Unit for Back Neck Shoulder Electronic Pulse Massager Fathers Day Gift 10 Pads
Comfytemp$22.834.6★
Hyperice Venom Go - Advanced Heat + Vibration Wearable (Venom Go)
Hyperice$116.733.9★
Demand & seasonality
Weekly Amazon search volume, last 104 weeks — -13.8% search growth over the last 90 days.Peak months: Feb, Mar, Apr, May · busiest ÷ quietest = 2.5×
Reviews
What buyers praise and complain about, mined from review topics.What buyers love
“Works well”
“Excellent product”
“Easy to use”
“Great value”
“Product is as advertised”
“It works effectively reducing muscle pain”
“Helps knee pain better sometimes than painkillers”
“amazing battery life”
“Very powerful for something so small”
“stickiness of pads is pretty decent”
What buyers complain about
“it doesnt stick well”
“Doesnt stay charged long enough”
“Not user friendly”
“Can not pick targeted area”
“Didnt even try it when I opened up the manual 16 pages of instructions ridiculous”
“Broke after a month”
“battery doesnt last”
“There's a quality control issue”
“Connectivity issues”
“waste of money”