gnc testosterone booster for men
Skip itBrand-locked demand (top 5 brands take 100% of clicks) — this niche doesn't clear our bar today.
Returns
Incredible0.0%return rate — above 6% kills the launch gate
Avg price
Great$47.83avg listing price — sweet spot $15–$100
Price range
Great$9.81–$87.59cheapest to priciest tracked listing — scored on the share inside $15–$100
Quality gap
Good4.3★avg incumbent rating — lower means beatable quality
Conversion
Okay3.5%search→purchase rate — share of searches ending in a sale
Competition
Okay65%top-5 click share — leaders hold, buyers still browse
Review moat
Bad8,623.64avg incumbent reviews — the moat a new listing must climb
Growth
Bad-7.9%90-day search growth — must beat 0% to launch
Market size
Bad$78K$78K/yr · 47K searches
Brand share
Bad100%top-5 brand share — brand-locked demand
Competition
The top 5 products take 65% of clicks — established leaders, but buyers still shop beyond them.Brands
5 falling
Sellers
34
Top-5 brand share
100%
Open market
0%
- GNC76%
- Nugenix11%
- Nutricost5%
- Prime Labs5%
- Kaya Naturals2%
Product shelf
Each bubble is one product — market share against review moat; bubble size tracks estimated sales, color grades how beatable the incumbent looks.
All 14 tracked products in this niche — three views at once, no toggling.
Top sellers
by 90-day click share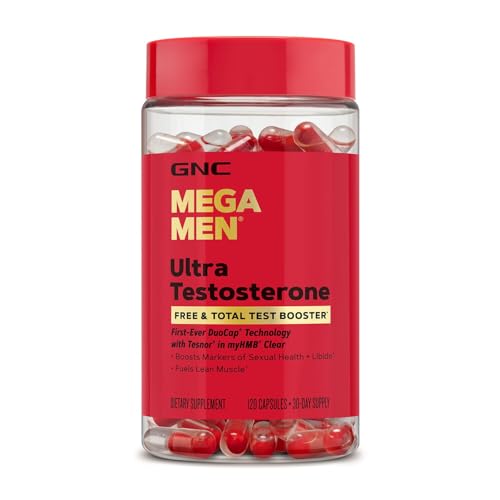
GNC Mega Men Ultra Testosterone for Men Free & Total Test Booster 120 Count
GNC$87.594.3★137 rev

GNC Mega Men Healthy Testosterone Program for Men Complete Nutrition 4 Products in 1 Boost Free and Total Testosterone Blood Flow 30 Daily Packs
GNC$83.584.3★187 rev
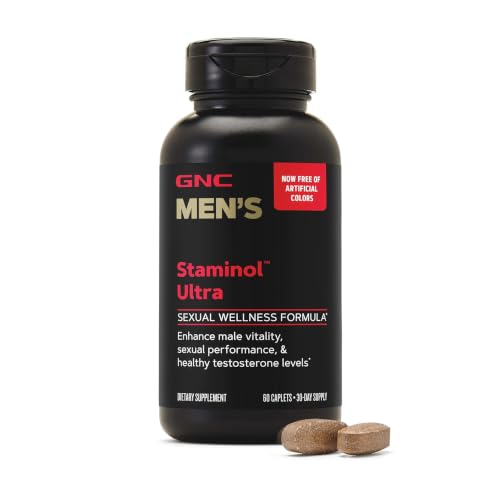
GNC Mens Staminol Ultra - Mens Wellness Supplement for Healthy Circulatory System Support - Multivitamin Blend - Vitality & Energy Support - 60 Count (30 Servings)
GNC$45.004.4★41 rev
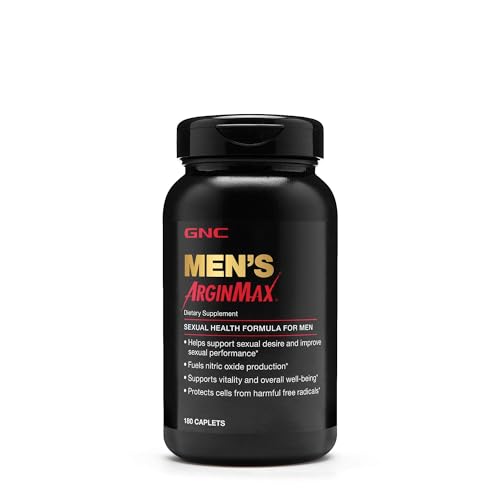
GNC Mens Arginmax Sexual Health Supplement for Men 180 Count Supports Blood Flow and Vitality
GNC$47.314.1★2,386 rev
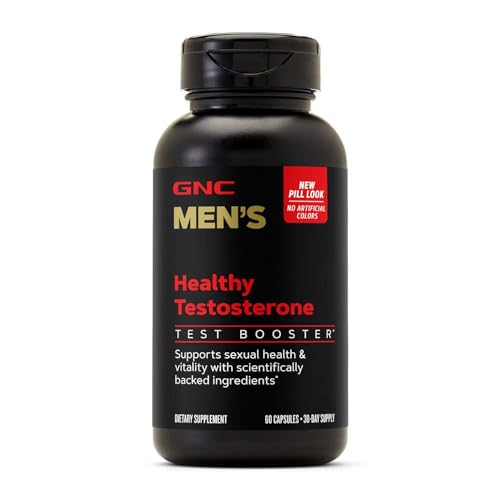
GNC Mens Healthy Testosterone - Mens Wellness Supplement for Muscle Health & Energy Support - Vascular Health Formula - Fenugreek Seed Extract Ginseng & Multivitamin Blend - 60 Count (30 Servings)
GNC$56.550.0★0 rev
Newest
by launch dateGNC Mens Healthy Testosterone - Mens Wellness Supplement for Muscle Health & Energy Support - Vascular Health Formula - Fenugreek Seed Extract Ginseng & Multivitamin Blend - 60 Count (30 Servings)
GNC$56.550 rev
GNC Mens Staminol Ultra - Mens Wellness Supplement for Healthy Circulatory System Support - Multivitamin Blend - Vitality & Energy Support - 60 Count (30 Servings)
GNC$45.0041 rev
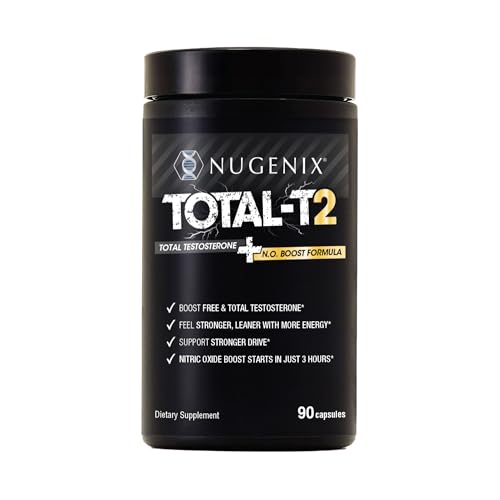
Nugenix Total-T2 - Testosterone Booster and Nitric Oxide Booster for Men Tesnor S7 ElevATP Tongkat Citrulline Nitric Oxide and Testosterone Supplement for Men (90 Count)
Nugenix$79.92682 rev
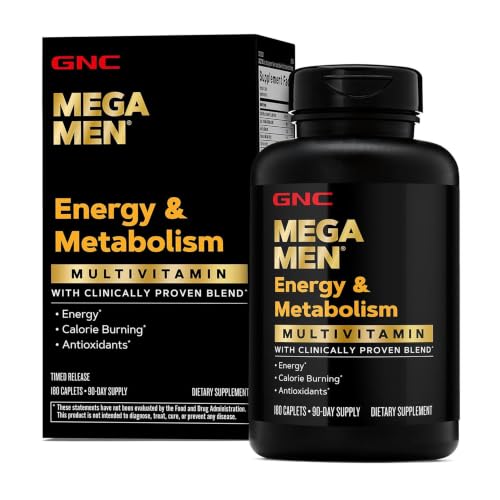
GNC Mega Men Energy & Metabolism Multivitamin for Men | Antioxidants and Increased Calorie Burning | 180 Count
GNC$33.451,179 rev

Nugenix Total-T Free and Total Testosterone Booster Supplement for Men 42 Count
Nugenix$35.035,046 rev
Trending
90-day click momentum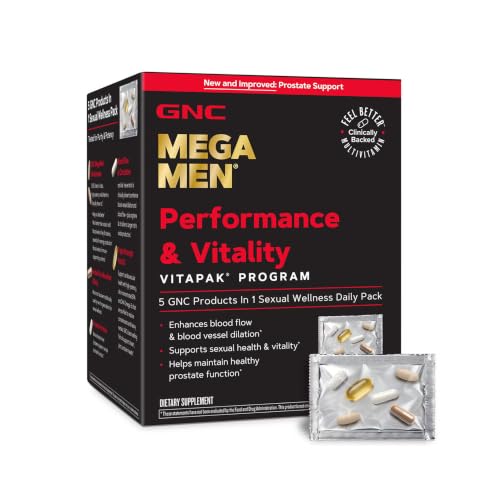
GNC Mega Men Performance and Vitality Vitapak Program for Men Convenient Complete Nutrition 5 Products in 1 Pack Circulation Blood Flow Stronger Drive - New & Improved - 30 Packs
GNC$57.664.5★
GNC Mens Healthy Testosterone - Mens Wellness Supplement for Muscle Health & Energy Support - Vascular Health Formula - Fenugreek Seed Extract Ginseng & Multivitamin Blend - 60 Count (30 Servings)
GNC$56.550.0★
Nugenix Total-T Free and Total Testosterone Booster Supplement for Men 42 Count
Nugenix$35.034.3★
Nugenix Total-T2 - Testosterone Booster and Nitric Oxide Booster for Men Tesnor S7 ElevATP Tongkat Citrulline Nitric Oxide and Testosterone Supplement for Men (90 Count)
Nugenix$79.924.2★
GNC Mega Men Energy & Metabolism Multivitamin for Men | Antioxidants and Increased Calorie Burning | 180 Count
GNC$33.454.7★
Demand & seasonality
Weekly Amazon search volume, last 99 weeks — -7.9% search growth over the last 90 days.Peak months: Jan, Feb, Mar, Oct, Nov, Dec · busiest ÷ quietest = 10.3×
Reviews
What buyers praise and complain about, mined from review topics.What buyers love
“Excellent Product”
“Energy level has improved”
“Excellent vitamins”
“Effective”
“Very affordable”
“Better than advertised”
“No odd side effects”
“The supplement portion of this is great”
“Very powerful”
“Hormone replacement therapy”
What buyers complain about
“Did not work”
“It's not a great value”
“Been taking this supplement and it does nothing”
“Haven't noticed my energy levels change”
“Looking for the cause of the edema found this product can have this adverse effect”
“Low quality waste of money”
“Questionable vitamin”
“Does not work as advertised”
“Decrease in libido, decrease in sex drive”
“Really upset stomach”