eagle brand medicated oil
Worth a lookShows low returns (0.3%), but a failed launch gate (market size, growth, or returns) keeps it on the watch list.
Returns
Incredible0.3%return rate — above 6% kills the launch gate
Avg price
Incredible$27.79avg listing price — sweet spot $15–$100
Price range
Great$7.35–$75.18cheapest to priciest tracked listing — scored on the share inside $15–$100
Conversion
Great9.1%search→purchase rate — share of searches ending in a sale
Market size
Good$601K$601K/yr · 237K searches
Review moat
Good966.78avg incumbent reviews — the moat a new listing must climb
Competition
Okay58%top-5 click share — leaders hold, buyers still browse
Quality gap
Okay4.5★avg incumbent rating — lower means beatable quality
Brand share
Okay88%top-5 brand share — brands hold most of the demand
Growth
Bad-0.2%90-day search growth — must beat 0% to launch
Competition
The top 5 products take 58% of clicks — established leaders, but buyers still shop beyond them.Brands
11 falling
Sellers
55
Top-5 brand share
88%
Open market
8%
- Eagle Brand29%
- HerbsDepo19%
- Po Sum On17%
- Eagle17%
- Tiger Balm6%
- Prince Of Peace3%
- Open — no brand owns it (5 brands, 8%)
Product shelf
Each bubble is one product — market share against review moat; bubble size tracks estimated sales, color grades how beatable the incumbent looks.
All 23 tracked products in this niche — three views at once, no toggling.
Top sellers
by 90-day click share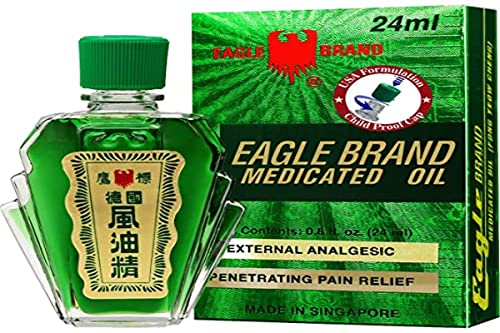
Eagle Brand Medicated Oil 0.81 Fl Oz (Pack of 1)
Eagle$7.354.5★1,261 rev
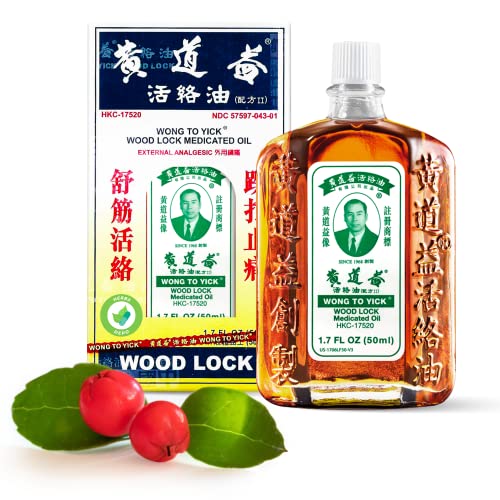
Wong to Yick - Wood Lock Medicated Oil - Herbal Pain Relief for Muscular Aches Sprains Shoulder and Back Pain - for Sports Recovery Soreness - 1.7 Fl Oz - 50 ML (1 Pack) 100% Authentic
HerbsDepo$22.024.6★961 rev
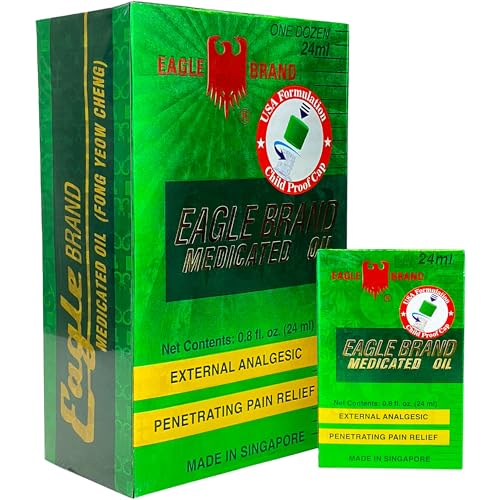
Eagle Brand Natural Medicated Oil Includes 12 Individual 0.8oz. Bottles
Eagle Brand$54.324.4★359 rev
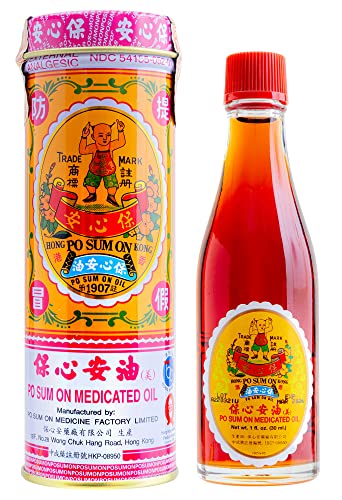
Po Sum On Medicated Oil (Muscle Joint Back Pain Relief) (1.0 Fl Oz) (1 Bottle) (Solstice)
Po Sum On$26.334.6★182 rev
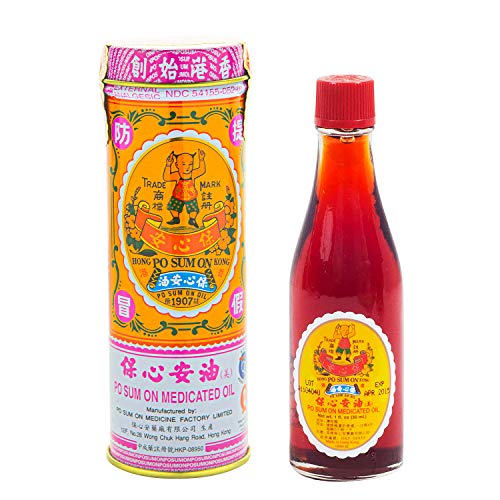
Po Sum On Medicated Oil (Muscle Joint Back Pain Relief) (1.0 Fl Oz) (1 Bottle) (Solstice)
Po Sum On$24.884.7★611 rev
Newest
by launch date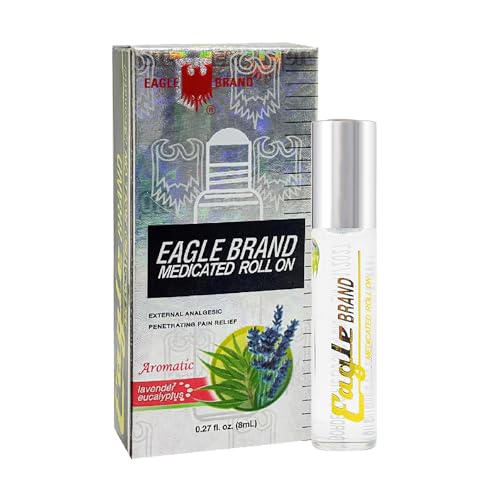
Eagle Brand Medicated Oil Aromatic Roll-On Lavender & Eucalyptus Pack of 12
Eagle Brand$32.8334 rev
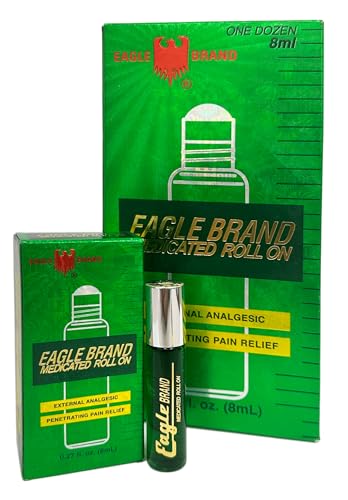
Eagle Brand Medicated Oil Roll-On Dozen Pack Pack of 12
Eagle Brand$32.5118 rev
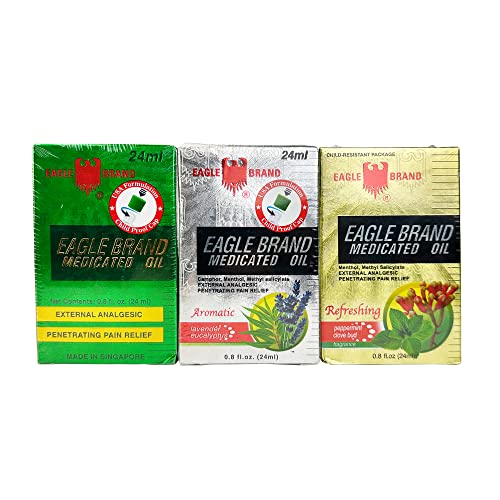
Eagle Brand Natural Medicated Oils for Muscle Aches and Pains Includes Eucalyptus Rose Mint Aromatic Lavender Eucalyptus and Gold Peppermint and Clove Bud Oil Bottle Variety Pack of 3
Generic$17.0692 rev

Eagle Brand Medicated Green Oil 36mL 1.2 fl oz Large Pack of 3
Eagle Brand$25.8561 rev
Wong to Yick - Wood Lock Medicated Oil - Herbal Pain Relief for Muscular Aches Sprains Shoulder and Back Pain - for Sports Recovery Soreness - 1.7 Fl Oz - 50 ML (1 Pack) 100% Authentic
HerbsDepo$22.02961 rev
Trending
90-day click momentumEagle Brand Natural Medicated Oils for Muscle Aches and Pains Includes Eucalyptus Rose Mint Aromatic Lavender Eucalyptus and Gold Peppermint and Clove Bud Oil Bottle Variety Pack of 3
Generic$17.064.5★
Po Sum On Medicated Oil (Muscle Joint Back Pain Relief) (1.0 Fl Oz) (1 Bottle) (Solstice)
Po Sum On$26.334.6★

TIGER BALM LINIMENT 2 Fl Oz (Pack of 2)
Tiger Balm$21.554.6★
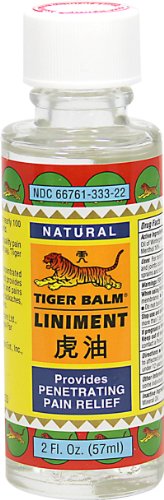
Tiger Balm Liniment 2 Fluid Ounce
Tiger Balm$13.904.6★
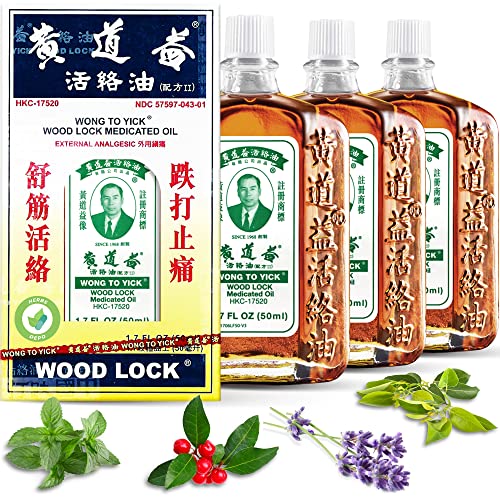
3 Pack of Wong to Yick - Wood Lock Medicated Oil - Muscular Aches Sprains Bruises Shoulder and Back Pain - for Sports Recovery Soreness - 1.7 Fl Oz - 50 ML - 100% Authentic
HerbsDepo$47.754.6★
Demand & seasonality
Weekly Amazon search volume, last 88 weeks — -0.2% search growth over the last 90 days.No pronounced peak months · busiest ÷ quietest = 1.6×
Reviews
What buyers praise and complain about, mined from review topics.What buyers love
“Good product, as expected”
“Smell so good”
“Effective”
“Provides excellent relief for muscle and joint pain”
“Muscle relief”
“Very affordable”
“My massage therapist recommended it”
“Great for sinuses, headaches, etc”
“Very good oil”
“As Advertised”
What buyers complain about
“extremely strong smelling”
“it doesnt really relief too much of the pain”
“It came in leaked”
“No heat, not effective, did not thing for my muscle pain”
“Returned Customer. Great used before”
“Over priced”
“It doesnt feel as strong or effective as it used to”
“Didnt work for me”
“The bottle is small”
“Watery”