dr nathan bryan
Worth a lookShows low returns (0.0%), but brand-locked demand (top 5 brands take 100% of clicks) keeps it on the watch list.
Returns
Incredible0.0%return rate — above 6% kills the launch gate
Avg price
Great$62.65avg listing price — sweet spot $15–$100
Conversion
Great9.5%search→purchase rate — share of searches ending in a sale
Price range
Great$14.77–$118.62cheapest to priciest tracked listing — scored on the share inside $15–$100
Quality gap
Great4.3★avg incumbent rating — lower means beatable quality
Market size
Good$494K$494K/yr · 83K searches
Review moat
Okay2,454.57avg incumbent reviews — the moat a new listing must climb
Growth
Bad-2.9%90-day search growth — must beat 0% to launch
Competition
Bad93%top-5 click share — a locked-up shelf
Brand share
Bad100%top-5 brand share — brand-locked demand
Competition
The top 5 products capture 93% of clicks — a locked-up shelf that new listings rarely crack.Brands
4 rising
Sellers
8
Top-5 brand share
100%
Open market
0%
- N1O181%
- NO2U10%
- Nutricost5%
- MyFitStrip4%
- Open — no brand owns it (0%)
Product shelf
Each bubble is one product — market share against review moat; bubble size tracks estimated sales, color grades how beatable the incumbent looks.
All 7 tracked products in this niche — three views at once, no toggling.
Top sellers
by 90-day click share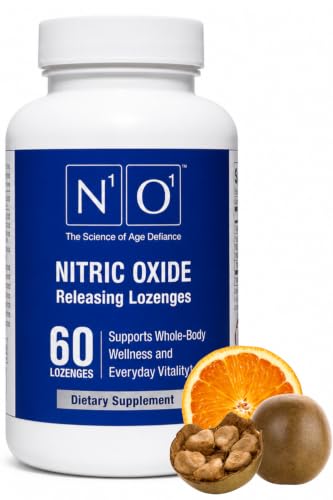
N1O1 Nitric Oxide Lozenges 60 Count 30-Day Supply Supplement
N1O1$57.904.2★1,346 rev
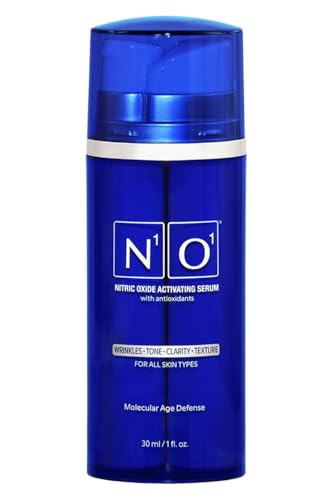
Nitric Oxide Activating Serum with Antioxidants | Hydrating Serum For Face | Decreases Wrinkles | Pore Minimizer | Improves Skin Texture | Helps Dark Spots | 1 Fl Oz 30ml
N1O1$96.464.1★329 rev

NO2U Bryan Nitriceuticals Nitric Oxide Supplement 60 Count 30 Day Supply
NO2U$56.024.2★337 rev
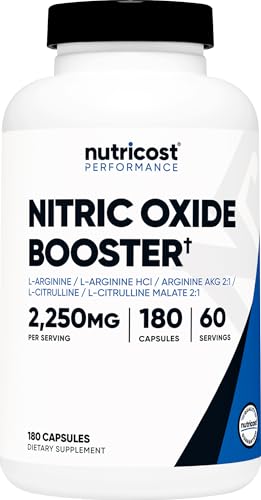
Nutricost Nitric Oxide Booster 2250mg 180 Capsules - 750mg Per Casule 60 Servings - Gluten Free and Non-GMO
Nutricost$14.774.5★13,609 rev
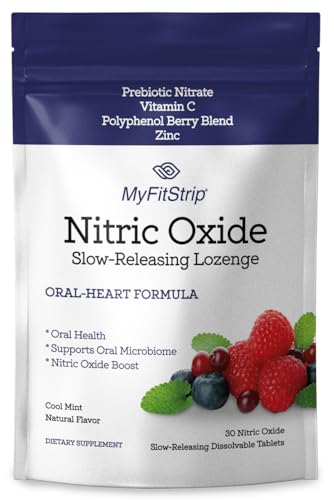
MyFitStrip Nitric Oxide Lozenges - Oral Health & Cardiovascular Support - Prebiotic Nitric Oxide Vitamin C Polyphenol-Rich Berry Blend and Zinc - 30 Cool Mint
MyFitStrip$28.134.6★43 rev
Newest
by launch dateMyFitStrip Nitric Oxide Lozenges - Oral Health & Cardiovascular Support - Prebiotic Nitric Oxide Vitamin C Polyphenol-Rich Berry Blend and Zinc - 30 Cool Mint
MyFitStrip$28.1343 rev
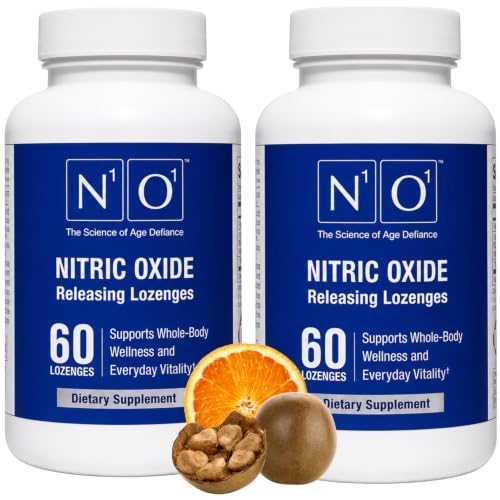
N1O1 Nitric Oxide Lozenges 120 Count 60-Day Supply Supplement
N1O1$118.621,346 rev
NO2U Bryan Nitriceuticals Nitric Oxide Supplement 60 Count 30 Day Supply
NO2U$56.02337 rev

N1O1 N.O. Beetz Nitric Oxide Powder Supplement Mixed Berry 30 Servings
N1O1$66.63172 rev
N1O1 Nitric Oxide Lozenges 60 Count 30-Day Supply Supplement
N1O1$57.901,346 rev
Trending
90-day click momentumN1O1 Nitric Oxide Lozenges 120 Count 60-Day Supply Supplement
N1O1$118.624.2★
Nitric Oxide Activating Serum with Antioxidants | Hydrating Serum For Face | Decreases Wrinkles | Pore Minimizer | Improves Skin Texture | Helps Dark Spots | 1 Fl Oz 30ml
N1O1$96.464.1★
MyFitStrip Nitric Oxide Lozenges - Oral Health & Cardiovascular Support - Prebiotic Nitric Oxide Vitamin C Polyphenol-Rich Berry Blend and Zinc - 30 Cool Mint
MyFitStrip$28.134.6★
N1O1 Nitric Oxide Lozenges 60 Count 30-Day Supply Supplement
N1O1$57.904.2★
N1O1 N.O. Beetz Nitric Oxide Powder Supplement Mixed Berry 30 Servings
N1O1$66.634.2★
Demand & seasonality
Weekly Amazon search volume, last 65 weeks — -2.9% search growth over the last 90 days.Peak months: Jul · busiest ÷ quietest = 2.1×
Reviews
What buyers praise and complain about, mined from review topics.What buyers love
“Hands down, best brand that we have found after researching for months”
“Low price”
“helps with energy”
“Worked as advertised”
“found them to be highly effective”
“Fresh Taste with Health Benefits”
“Great find for high blood pressure”
“Love this vitamin”
“a nice smooth mint flavor”
“Great benefits to healthy diet and food absorption”
What buyers complain about
“EXPENSIVE”
“Didn't work for me”
“Low volume per dose”
“Made me sick”
“My blood pressure is higher than it has ever been”
“I doubt with the low percentage of ingredients I ever would”
“Got stomach discomfort”
“I thought what I was seeing in my mouth was an allergic reaction to something”
“But I cant do so comfortably”
“is not Halal or Kosher friendly”