cream cheese powder
Skip itBrand-locked demand (top 5 brands take 96% of clicks) — this niche doesn't clear our bar today.
Returns
Incredible0.0%return rate — above 6% kills the launch gate
Avg price
Incredible$38.02avg listing price — sweet spot $15–$100
Quality gap
Great4.3★avg incumbent rating — lower means beatable quality
Conversion
Good4.8%search→purchase rate — share of searches ending in a sale
Growth
Good+21.4%90-day search growth — must beat 0% to launch
Price range
Okay$9.92–$247.65cheapest to priciest tracked listing — scored on the share inside $15–$100
Market size
Okay$101K$101K/yr · 55K searches
Review moat
Bad4,134.69avg incumbent reviews — the moat a new listing must climb
Competition
Bad72%top-5 click share — a locked-up shelf
Brand share
Bad96%top-5 brand share — brand-locked demand
Competition
The top 5 products capture 72% of clicks — a locked-up shelf that new listings rarely crack.Brands
7 rising
Sellers
10
Top-5 brand share
96%
Open market
2%
- Hoosier Hill Farm37%
- Z Natural Foods35%
- OLIVENATION12%
- Judee's Gluten Free7%
- Better Made4%
- Future Essentials3%
- Open — no brand owns it (1 brand, 2%)
Product shelf
Each bubble is one product — market share against review moat; bubble size tracks estimated sales, color grades how beatable the incumbent looks.
All 13 tracked products in this niche — three views at once, no toggling.
Top sellers
by 90-day click share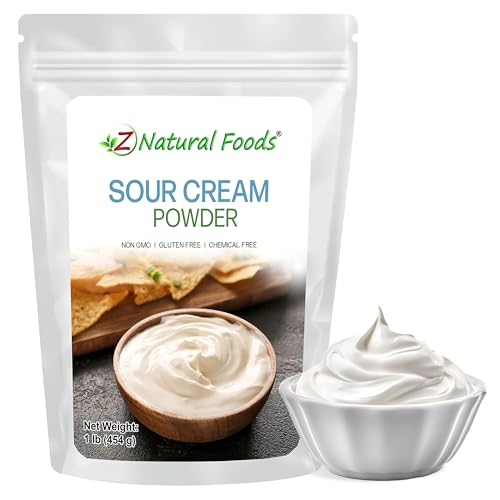
Z Natural Foods Sour Cream Powder - Creamy Low-Lactose with Probiotics Powdered for Long Shelf Life - Easy 2:1 Mix for Baking Toppings Dips Sour Cream & Onion Seasoning - Non-GMO Gluten-Free
Z Natural Foods$17.244.0★271 rev
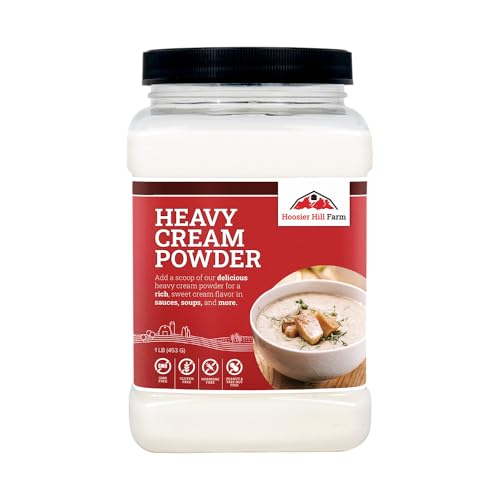
Heavy Cream Powder by Hoosier Hill Farm 1LB (Pack of 1)
Hoosier Hill Farm$19.944.3★19,477 rev
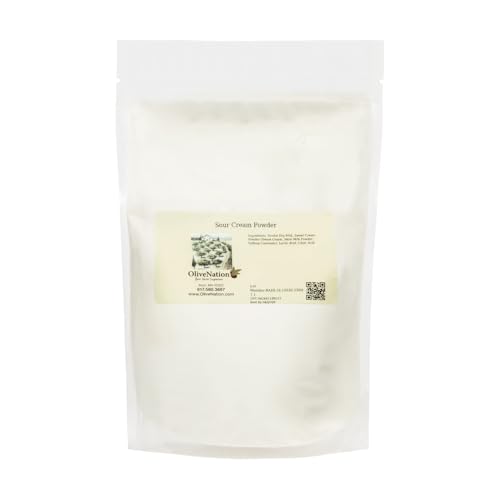
OliveNation Sour Cream Powder - Sour Cream Powder Mix for Baking Cooking Seasoning Sauces/Dips (16.00oz)
OLIVENATION$15.404.6★10 rev

Hoosier Hill Farm Cream Cheese Powder 1LB (Pack of 1)
Hoosier Hill Farm$23.054.4★1,673 rev

Judees Gluten Free Powdered Sour Cream - Freeze-Dried Sour Cream Powder for Baking & Dips - Non-GMO & Gluten-Free Mix - 11.25 Oz - Pack of 1
Judee's Gluten Free$16.904.4★442 rev
Newest
by launch date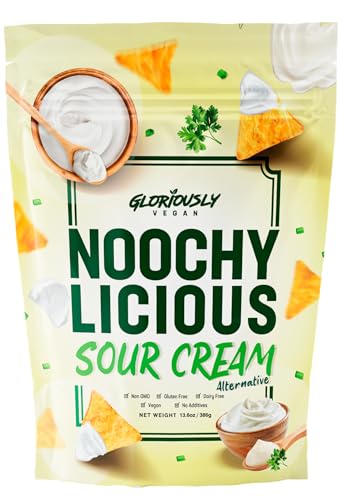
Gloriously Vegan NoochyLicious Sour Cream Powder Smooth Tangy Dairy-Free & Plant-Based Seasoning Lactose-Free Gluten-Free Non-GMO Sour Cream Alternative for Cooking & Snacking
Gloriously Vegan$29.865 rev
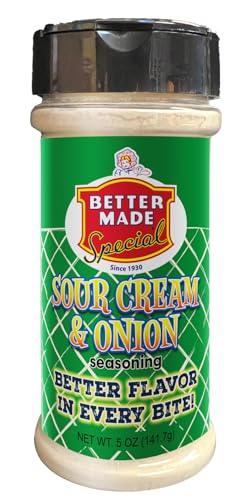
Better Made Flavored Seasoning Shaker (SOUR CREAM & ONION)
Better Made$9.9233 rev
OliveNation Sour Cream Powder - Sour Cream Powder Mix for Baking Cooking Seasoning Sauces/Dips (16.00oz)
OLIVENATION$15.4010 rev
OliveNation Sour Cream Powder - Sour Cream Powder Mix for Baking Cooking Seasoning Sauces/Dips (32.00oz)
OLIVENATION$25.9010 rev
Z Natural Foods Sour Cream Powder - Creamy Low-Lactose with Probiotics Powdered for Long Shelf Life - Easy 2:1 Mix for Baking Toppings Dips Sour Cream & Onion Seasoning - Non-GMO Gluten-Free
Z Natural Foods$17.24271 rev
Trending
90-day click momentum
Hoosier Hill Farm Sour Cream Powder 25LB (Pack of 1)
Hoosier Hill Farm$247.654.3★
Better Made Flavored Seasoning Shaker (SOUR CREAM & ONION)
Better Made$9.924.2★
Heavy Cream Powder by Hoosier Hill Farm 1LB (Pack of 1)
Hoosier Hill Farm$19.944.3★
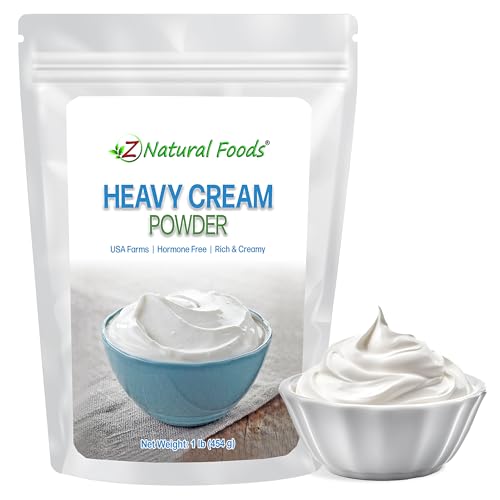
Z Natural Foods Heavy Cream Powder - Nutrient-Dense Delicious Powdered Cream with 1-Year Shelf Life - Easy to Use & Perfect for Coffee Baking & Recipes Keto-Friendly Gluten-Free 1 lb
Z Natural Foods$18.844.4★
OliveNation Sour Cream Powder - Sour Cream Powder Mix for Baking Cooking Seasoning Sauces/Dips (32.00oz)
OLIVENATION$25.904.6★
Demand & seasonality
Weekly Amazon search volume, last 104 weeks — +21.4% search growth over the last 90 days.Peak months: May, Oct · busiest ÷ quietest = 1.7×
Reviews
What buyers praise and complain about, mined from review topics.What buyers love
“It is fresh and tastes great”
“good quality powder, no clumps”
“Great value”
“as advertised”
“Great for baking”
“its easy to open”
“when you are on a keto diet, carbs count and this is an easy way to make low carb bread”
“Sour cream”
“Everything arrived fresh”
“Great flavor”
What buyers complain about
“Bad taste”
“that means it frequently goes sour very quickly”
“Waste of money”
“It just clumps”
“Extremely grainy”
“by adding more powder it only gets like a thicker grainy glue”
“The product has lots of chemicals added”
“Not the quality I expected”
“But this flavor is kinda bland”
“Does not smell or taste like real dairy cream”