atkins protein chips
Skip it28/100a concentrated shelf (top 5 take 100% of clicks) — atkins protein chips doesn't clear our bar today.
Market/yr
$165K
Growth (1y)
+13.2%
Products
4
Brands
1
was 3 a year ago
Sellers
7
Price range
$9.04–$25.30
Returns
0.0%
Rating
4.5★
Skip it
Scored 28/100 across market size, growth, competition, quality gap, and returns.
Demand
Weekly Amazon search volume, last 96 weeks — +13.2% year over year.Seasonality
Monthly demand index across the year — 1.00 is average.Peak months: Jul, Aug · busiest ÷ quietest = 66.4×
Competition
- Quest100%
The top 5 products capture 100% of clicks — a locked-up shelf that new listings rarely crack. 1 brands and 7 sellers compete here.
Brands
1 falling
was 3 a year ago
Sellers
7
Top 5 brand share
100%
Product shelf
All 4 tracked products in this niche.
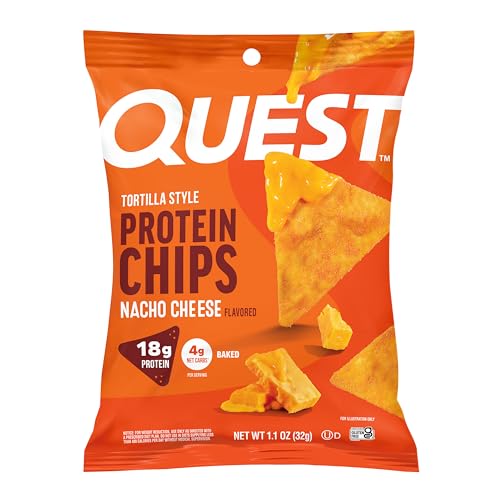
Quest Nutrition Nacho Cheese Tortilla Style Protein Chips 18g Protein 4g Net Carb Low Carb Gluten Free 1.1 oz (Pack of 12)
Quest
$25.304.5★24,658 reviews
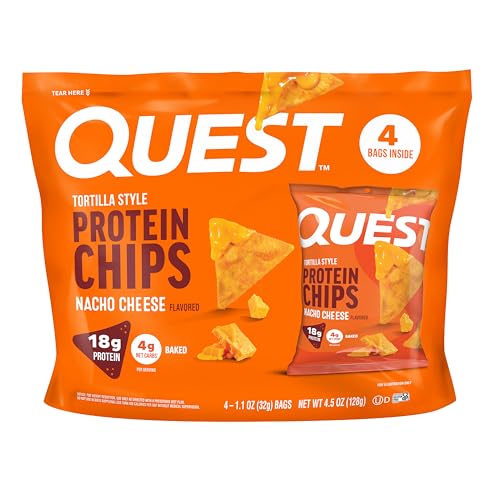
Quest Nutrition Nacho Cheese Tortilla Style Protein Chips 18g Protein 4g Net Carb Low Carb Gluten Free 1.1 oz (Pack of 4)
Quest
$9.044.5★24,658 reviews
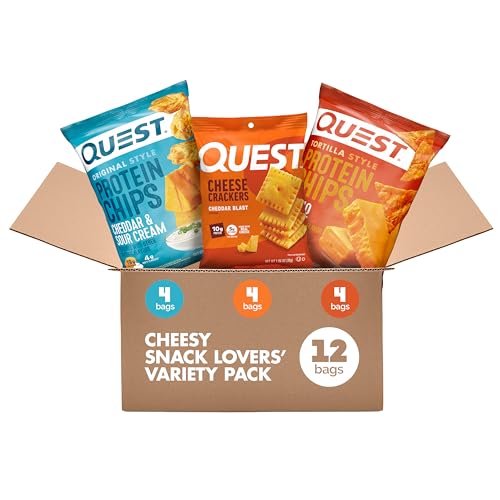
Quest Nutrition Cheese Lovers Variety Pack Nacho Tortilla Style Protein Chips Cheddar & Sour Cream Chips Cheddar Blast Crackers (4 of Each) 1.1 oz 12 Count
Quest
$24.894.6★423 reviews
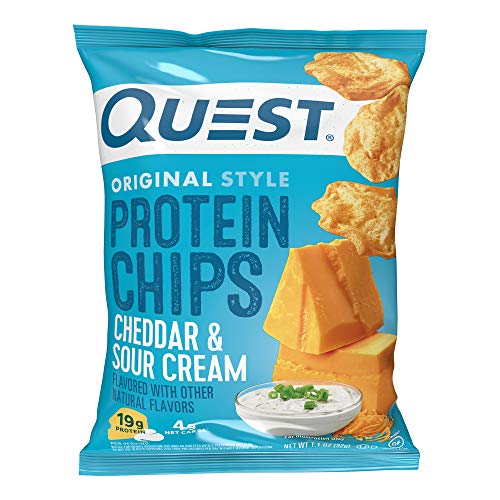
Quest Nutrition Cheddar & Sour Cream Protein Chips 19g Protein 4g Net Carbs Low Carb Gluten Free 1.1 oz (Pack of 12)
Quest
$22.484.4★7,399 reviews
Reviews
What buyers praise and complain about, mined from review topics.What buyers love
“Absolutely delicious”
“an easy way to get some protein”
“true to flavors”
“Loved the variety”
“cheaper than Wal-Mart”
“sour cream variety”
“Great combination, the crackers were a nice addition to this combo”
“Very easy to install”
“They still have the texture I like as well”
“Its a convenient option for a quick”
What buyers complain about
“Little pricey”
“Taste horrible”
“Sodium is a bit high and additives”
“I don't like a strong protein flavor or grainy texture”
“Completely stale”
“Not as healthy as you think”
“the texture terrible”
“only lasted for a weekend lmao oops”
“hard to eat because texture is off”
“So I know these are not necessarily the purest ingredients”
Top return reasons
- Flavor37%
- Taste-Overall17%
- Salt Content13%
- Size-Overall7%
- Value For Money7%
- Functionality-Overall7%
- Quality-Overall7%
- Stale/Rotten/Spoiled7%