aches and pains essential oil
Skip itSoft demand (-73.6% this quarter) — this niche doesn't clear our bar today.
Returns
Incredible0.3%return rate — above 6% kills the launch gate
Avg price
Incredible$23.57avg listing price — sweet spot $15–$100
Price range
Great$9.95–$57.47cheapest to priciest tracked listing — scored on the share inside $15–$100
Quality gap
Okay4.5★avg incumbent rating — lower means beatable quality
Review moat
Okay1,926.4avg incumbent reviews — the moat a new listing must climb
Competition
Okay60%top-5 click share — leaders hold, buyers still browse
Conversion
Bad2.0%search→purchase rate — share of searches ending in a sale
Market size
Bad$59K$59K/yr · 127K searches
Growth
Bad-73.6%90-day search growth — must beat 0% to launch
Brand share
Bad100%top-5 brand share — brand-locked demand
Competition
The top 5 products take 60% of clicks — established leaders, but buyers still shop beyond them.Brands
5 falling
Sellers
46
Top-5 brand share
100%
Open market
0%
- Vitality85%
- FRANKINCENSE & MYRRH8%
- Edens Garden5%
- Wyndmere2%
- Wise Men1%
Product shelf
Each bubble is one product — market share against review moat; bubble size tracks estimated sales, color grades how beatable the incumbent looks.
All 20 tracked products in this niche — three views at once, no toggling.
Top sellers
by 90-day click share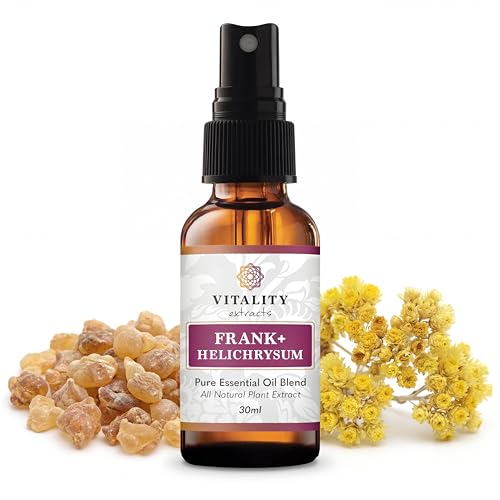
Vitality Extracts Frank+ Helichrysum Essential Oil Blend - 30ml Spray Bottle Frankincense Boswellia Seratta Aromatherapy Soft Skin Relief from Daily Aches & Soreness Natural
Vitality$21.514.6★333 rev
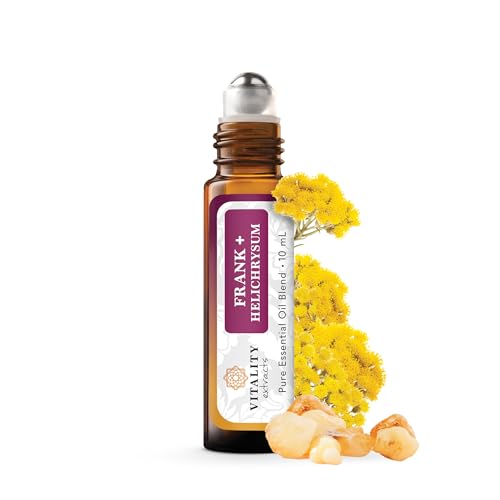
Vitality Extracts Frank+ Helichrysum Essential Oil Blend - 10ml Roll-On Frankincense Boswellia Seratta Aromatherapy Soft Skin Relief from Daily Aches & Soreness Natural
Vitality$16.534.6★121 rev
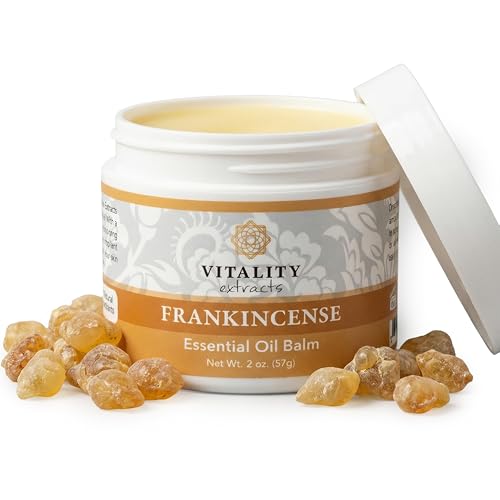
Vitality Extracts Frankincense Essential Oil Balm (2oz) Boswellia Serrata Beeswax & Vitamin E Deep Moisturizing Skin Balm for Dry Cracked Skin Soothing & Nourishing for All Skin Types
Vitality$18.764.4★2,361 rev
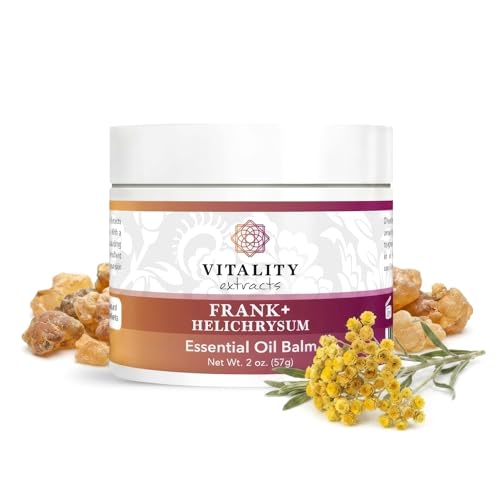
Vitality Extracts Frank+ Helichrysum Balm - 2oz Frankincense Boswellia Serrata Helichrysum Gymnocephalum All-Natural Relief Skin Soothing Beeswax
Vitality$24.254.8★80 rev

Frankincense & Myrrh Arthritis Pain Relief Rubbing Oil Dr Recommended 2 oz
FRANKINCENSE & MYRRH$20.934.4★4,294 rev
Newest
by launch dateVitality Extracts Frank+ Helichrysum Balm - 2oz Frankincense Boswellia Serrata Helichrysum Gymnocephalum All-Natural Relief Skin Soothing Beeswax
Vitality$24.2580 rev
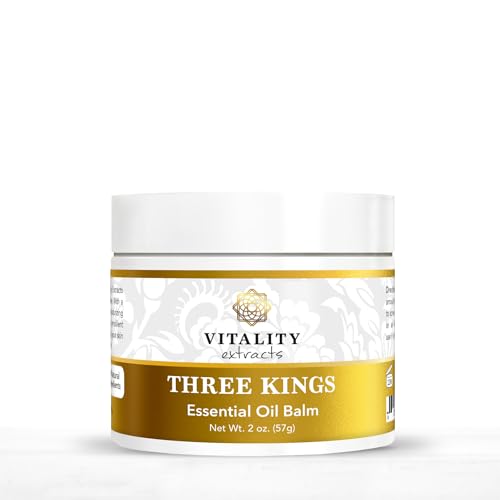
Vitality Extracts Three Kings Balm - 2oz Frankincense Myrrh Sandalwood Sacred Ultra-hydration Relief from Discomfort Soft Skin
Vitality$29.23145 rev
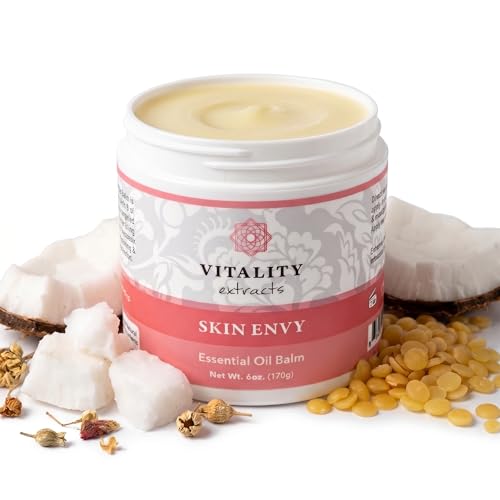
Vitality Extracts Skin Envy Essential Oil Balm - 6oz Moisturizer Beeswax Vitamin A Skin Care All Natural Coconut Oil
Vitality$57.47125 rev
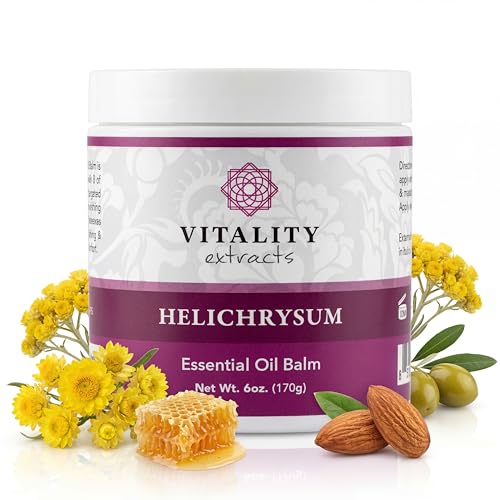
Vitality Extracts Helichrysum Balm - 6oz Helichrysum Gymnocephalum Beeswax Almond Oil Ultra-Moisturizing Skin Healing Full Body Hydration
Vitality$46.69395 rev
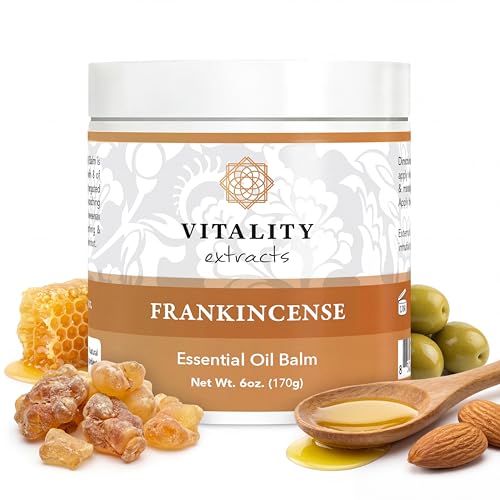
Vitality Extracts Frankincense Balm - 6oz Boswellia Serrata Beeswax Olive Oil Moisturizer for Dry Cracked Skin All Skin Types
Vitality$43.33753 rev
Trending
90-day click momentumVitality Extracts Frank+ Helichrysum Balm - 2oz Frankincense Boswellia Serrata Helichrysum Gymnocephalum All-Natural Relief Skin Soothing Beeswax
Vitality$24.254.8★
Vitality Extracts Three Kings Balm - 2oz Frankincense Myrrh Sandalwood Sacred Ultra-hydration Relief from Discomfort Soft Skin
Vitality$29.234.5★
Vitality Extracts Frank+ Helichrysum Essential Oil Blend - 10ml Roll-On Frankincense Boswellia Seratta Aromatherapy Soft Skin Relief from Daily Aches & Soreness Natural
Vitality$16.534.6★
Vitality Extracts Frank+ Helichrysum Essential Oil Blend - 30ml Spray Bottle Frankincense Boswellia Seratta Aromatherapy Soft Skin Relief from Daily Aches & Soreness Natural
Vitality$21.514.6★
Vitality Extracts Helichrysum Balm - 6oz Helichrysum Gymnocephalum Beeswax Almond Oil Ultra-Moisturizing Skin Healing Full Body Hydration
Vitality$46.694.5★
Demand & seasonality
Weekly Amazon search volume, last 104 weeks — -73.6% search growth over the last 90 days.Peak months: Jan, Oct, Dec · busiest ÷ quietest = 3.8×
Reviews
What buyers praise and complain about, mined from review topics.What buyers love
“Good product and different than I expected”
“fragrance is wonderful”
“Effective”
“Love this for my joints”
“helps dry skin”
“As advertised”
“Worth the money”
“Soft skin”
“This helps my skin”
“Application goes on easily”
What buyers complain about
“Does not work as advertised”
“Bad smell”
“Foot pain”
“too expensive”
“Skin rash”
“Does not work as advertised”
“much too greasy”
“not for long”
“No improvement”
“myrrh being inactive ingredients”