usmc hat
Worth a lookShows a sweet-spot price point ($20.89 avg), but a failed launch gate (market size, growth, or returns) keeps it on the watch list.
Avg price
Great$20.89avg listing price — sweet spot $15–$100
Competition
Great27%top-5 click share — an open shelf
Brand share
Great57%top-5 brand share — no brand owns this niche
Price range
Great$8.13–$35.33cheapest to priciest tracked listing — scored on the share inside $15–$100
Growth
Good+51.2%90-day search growth — must beat 0% to launch
Review moat
Good835.66avg incumbent reviews — the moat a new listing must climb
Returns
Good2.6%return rate — above 6% kills the launch gate
Market size
Okay$188K$188K/yr · 391K searches
Quality gap
Okay4.5★avg incumbent rating — lower means beatable quality
Conversion
Okay2.3%search→purchase rate — share of searches ending in a sale
Competition
Clicks spread well past the top 5 (27% combined) — an open shelf where new products get seen.Brands
34 rising
Sellers
91
Top-5 brand share
57%
Open market
37%
- Rothco20%
- 7.62 Design14%
- JM Warriors10%
- Generic7%
- Trendy Zone 217%
- MWS6%
Product shelf
Each bubble is one product — market share against review moat; bubble size tracks estimated sales, color grades how beatable the incumbent looks.
All 71 tracked products in this niche — three views at once, no toggling.
Top sellers
by 90-day click share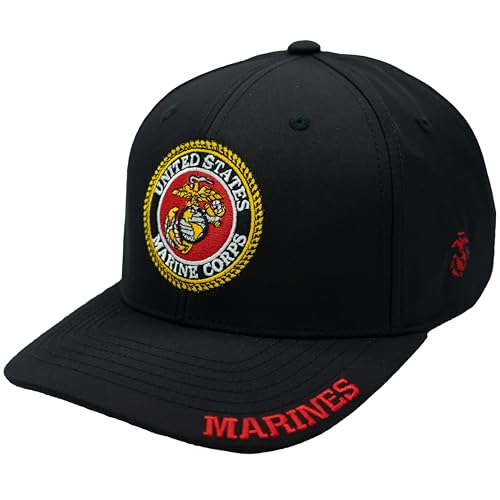
JM Warriors USMC Hat Marine Corps Logo Hat for Men and Women Officially Licensed Embroidered USMC Veteran Baseball Cap (US Alpha One Size Black)
JM Warriors$34.094.8★68 rev

7.62 Design USMC Semper Fidelis Vintage Trucker Hat Red
7.62 Design$25.424.6★502 rev
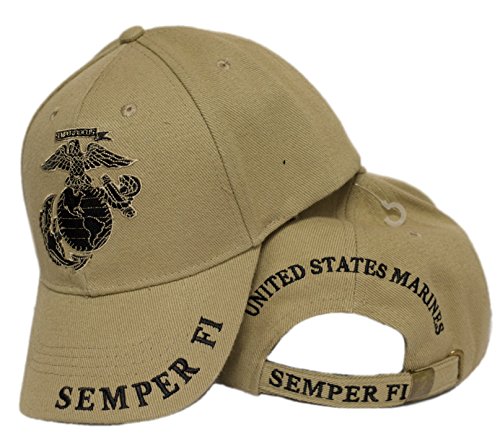
MWS U.S Marine USMC Semper Fi Logo Eagle Embroidered Cap Hat Beige
MWS$19.804.6★531 rev

Rothco Deluxe Vintage USMC Embroidered Low Pro Cap (US Alpha One Size Olive Drab)
Rothco$22.664.7★1,894 rev
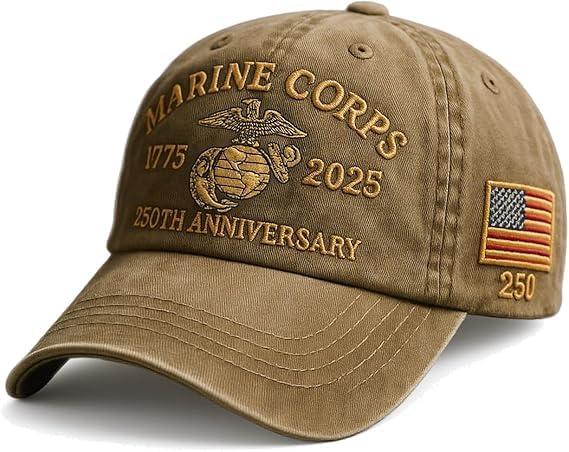
wibuxrf 250 Anniversary Marine Corps Hat Embroidered Baseball Hats USA 250th Patriotic Cap for Men Women Veteran Gifts
wibuxrf$9.174.2★44 rev
Newest
by launch date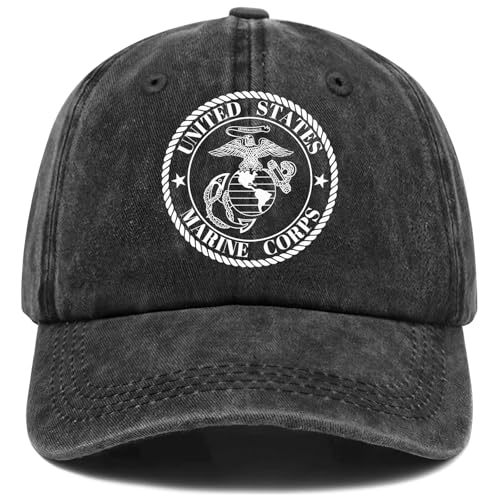
Craslly Marine Corps Gifts for Men - USMC for Men - Fathers Day Christmas Retirement Military Gifts - United States Marine Corps Adjustable Baseball Cap
Craslly$15.145 rev
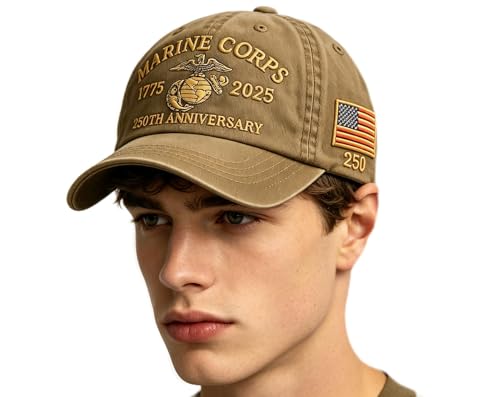
Marines Corps 250th Anniversary Baseball Cap for Men USMC Retro Washed Cap
Generic$8.1354 rev
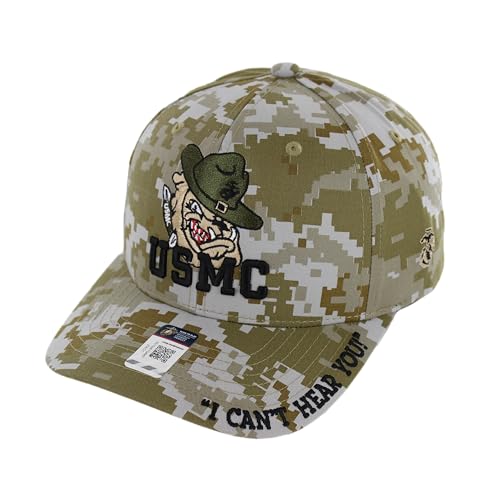
Officially Licensed U.S. Marine Military Veteran Baseball Cap - Marine USMC Bulldog Embroidered U.S. Flag Premium Quality Adjustable Hook-and-Loop Closure Hat Camo
Ace Cap$28.681 rev
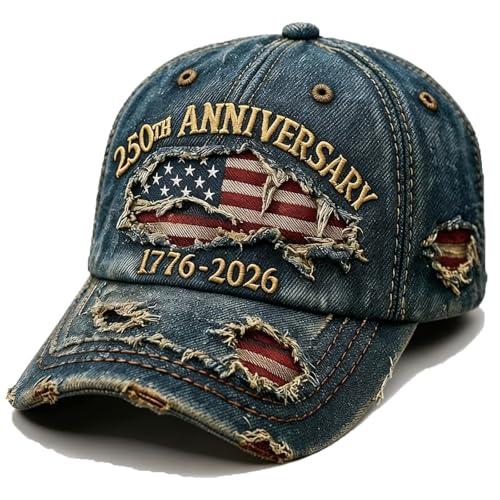
Okbycuyck 4th of July Hat 250 Anniversary USA Hat 250 Anniversary USA Merchandise Embroidered 1776-2026 Patriotic Retro Denim USA Hat for Dad Husband Fourth of July Baseball Cap for Men Women
Okbycuyck$14.1451 rev
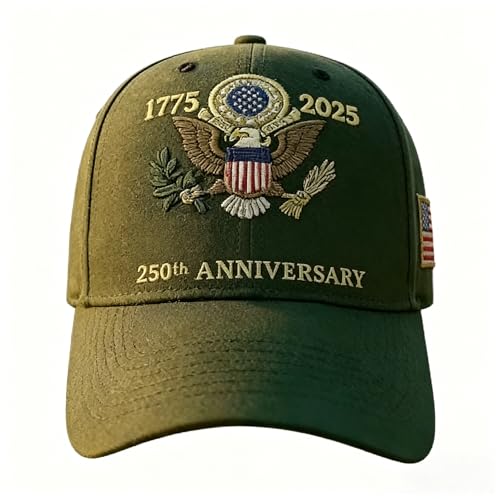
vgzyov 250th Patriotic Eagle Embroidery Dad Hat 1775-2025 National Spirit Flag Adjustable Outdoor Cap for Men Women Veterans (Green)
vgzyov$13.716 rev
Trending
90-day click momentum
250th Anniversary Cap Tribute Adjustable Marine Corps hat Veterans Cap
Generic$25.095.0★
Marines Corps 250th Anniversary Baseball Cap for Men USMC Retro Washed Cap
Generic$8.134.0★
wibuxrf 250 Anniversary Marine Corps Hat Embroidered Baseball Hats USA 250th Patriotic Cap for Men Women Veteran Gifts
wibuxrf$9.174.2★
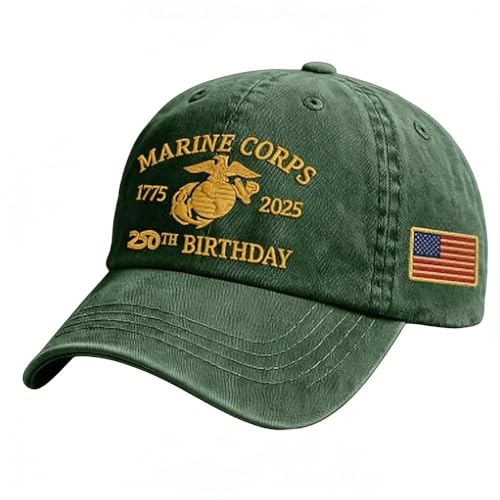
Yuonry Marine Corps Embroidered Baseball CapUSA 250th Anniversary Commemorative Cap Veteran Pride Adjustable Retro Baseball Hat(Green)
Yuonry$9.674.7★
Craslly Marine Corps Gifts for Men - USMC for Men - Fathers Day Christmas Retirement Military Gifts - United States Marine Corps Adjustable Baseball Cap
Craslly$15.142.6★
Demand & seasonality
Weekly Amazon search volume, last 104 weeks — +51.2% search growth over the last 90 days.Peak months: Jun, Nov, Dec · busiest ÷ quietest = 2.6×
Reviews
What buyers praise and complain about, mined from review topics.What buyers love
“it is a quality made cover”
“Fits great”
“As advertised”
“Great value”
“The colors are beautiful”
“the design looks absolutely beautiful”
“extremely comfortable”
“Nice relaxed shape”
“Fabric type: 100% Cotton”
“Was a gift”
What buyers complain about
“Too small”
“Lower Quality than expected”
“No Shape”
“Dont trust the picture”
“Color fades”
“Bad stitching”
“Cheap Materials”
“The price may have been a little high”
“flimsy”
“However, after wearing the cap literally one week, the stitching holding the adjusting velcro back strap came undone from one side, making the cap unwearable”