navy
Skip itWeak search conversion (0.7%) — this niche doesn't clear our bar today.
Avg price
Great$19.37avg listing price — sweet spot $15–$100
Brand share
Good61%top-5 brand share — brands hold most of the demand
Price range
Good$7.77–$34.64cheapest to priciest tracked listing — scored on the share inside $15–$100
Review moat
Good848.54avg incumbent reviews — the moat a new listing must climb
Competition
Good54%top-5 click share — leaders hold, buyers still browse
Growth
Good+23.7%90-day search growth — must beat 0% to launch
Returns
Good2.9%return rate — above 6% kills the launch gate
Quality gap
Bad4.6★avg incumbent rating — lower means beatable quality
Market size
Bad$81K$81K/yr · 616K searches
Conversion
Bad0.7%search→purchase rate — share of searches ending in a sale
Competition
The top 5 products take 54% of clicks — established leaders, but buyers still shop beyond them.Brands
22 falling
Sellers
54
Top-5 brand share
61%
Open market
34%
- Ann Arbor T-shirt Co.32%
- Artisan Owl9%
- HAPPYPOP7%
- Rothco7%
- Popfunk6%
- e4Hats.com5%
Product shelf
Each bubble is one product — market share against review moat; bubble size tracks estimated sales, color grades how beatable the incumbent looks.
All 28 tracked products in this niche — three views at once, no toggling.
Top sellers
by 90-day click share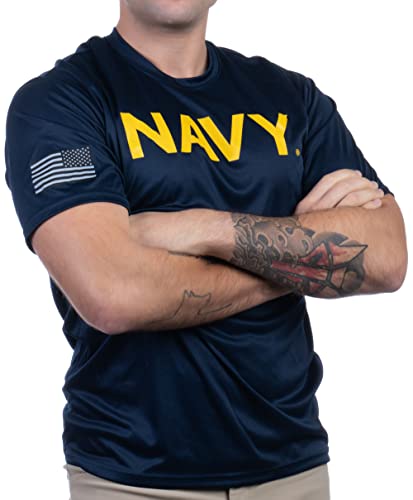
Ann Arbor T-shirt Co. Navy Wicking PT Style | U.S. Military Naval Sailor Performance Training Infantry Workout T-Shirt - (Poly L)
Ann Arbor T-shirt Co.$19.594.6★394 rev
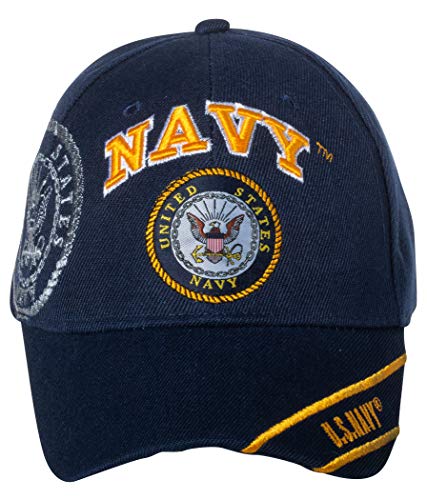
United States Navy Officially Licensed Logo Embroidered Baseball Cap (Navy Blue)
Artisan Owl$17.584.8★685 rev
Ann Arbor T-shirt Co. Navy Wicking PT Style | U.S. Military Naval Sailor Performance Training Infantry Workout T-Shirt - (Poly XL)
Ann Arbor T-shirt Co.$19.514.6★394 rev
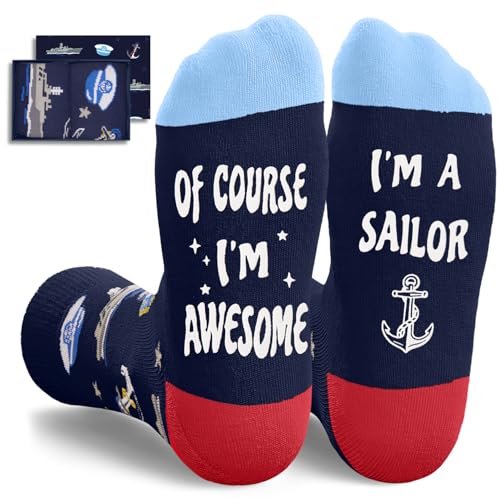
HAPPYPOP Military Gifts for Men - Army Navy Air Force Marine Corps Socks for Veterans Day (Awesome Im a Sailor)
HAPPYPOP$10.434.8★15 rev
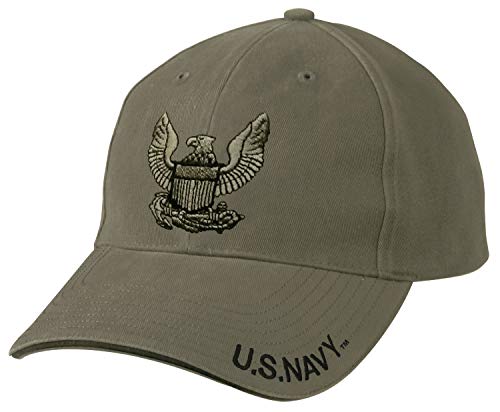
Rothco Vintage U.S. Navy Eagle Low Profile Cap Olive Drab
Rothco$18.994.6★286 rev
Newest
by launch dateHAPPYPOP Military Gifts for Men - Army Navy Air Force Marine Corps Socks for Veterans Day (Awesome Im a Sailor)
HAPPYPOP$10.4315 rev
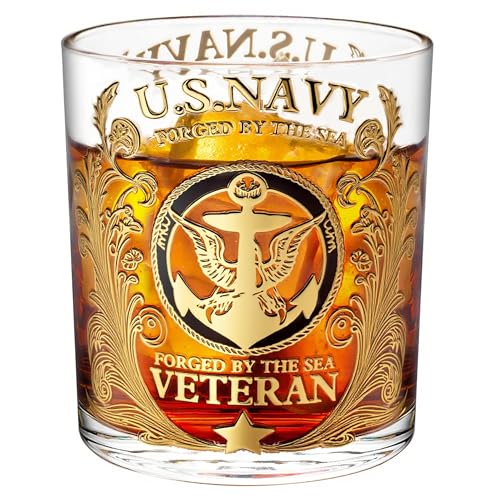
FEIOOD Veteran Tribute Whiskey Glass 10oz Personalized Engraved US Navy Whiskey Glass Patriotic Military Veteran Gift for Men Dad Husband Anniversary & Retirement Decorations1pcs
FEIOOD$15.4931 rev
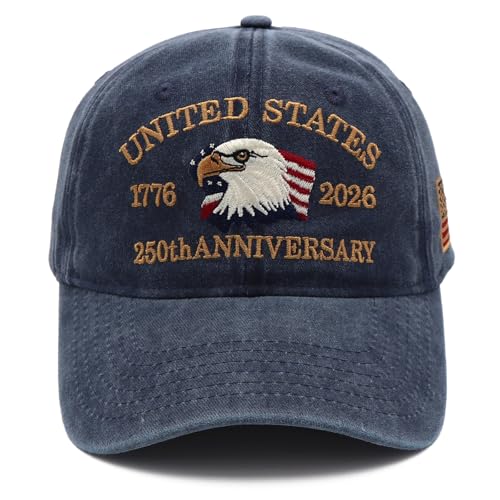
250th Anniversary USA Hat United States 250 Year American Anniversary Hat Patriotic Embroidery Adjustable Baseball Cap Navy Blue
Hiwelove$13.84260 rev
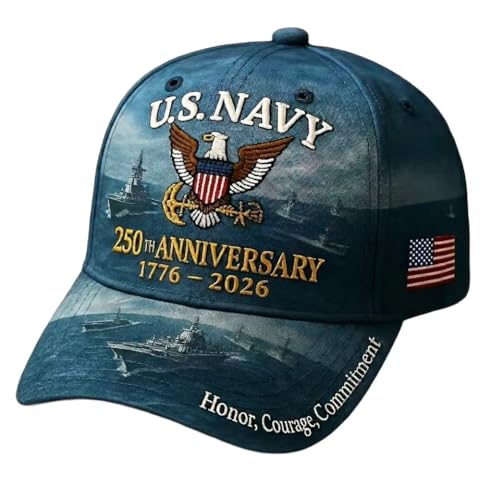
Efdaf 250th Anniversary Commemorative Cap All-Over Sublimation Printed Eagle Crest Baseball Hat 1776-2026 Patriotic Tribute Gift for Sailors and Veterans
Efdaf$19.56392 rev

Forged of Salt and Steel U.S. Naval Ships 250th Anniversary T-Shirt
Dibble Dabble Designs Military 250 Years Birthday$19.39124 rev
Trending
90-day click momentumHAPPYPOP Military Gifts for Men - Army Navy Air Force Marine Corps Socks for Veterans Day (Awesome Im a Sailor)
HAPPYPOP$10.434.8★

DLOODA Womens Skort Tennis Skirt with Pocket Shorts Mini Golf Skirts High Waisted Athletic Skorts Summer Workout Navy
DLOODA$14.454.6★
Efdaf 250th Anniversary Commemorative Cap All-Over Sublimation Printed Eagle Crest Baseball Hat 1776-2026 Patriotic Tribute Gift for Sailors and Veterans
Efdaf$19.563.9★
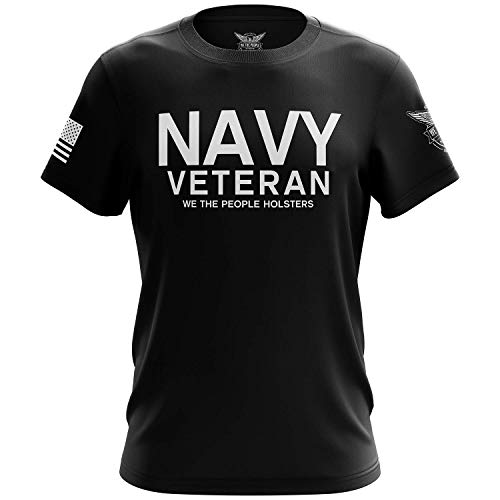
We The People Holsters - Navy Veteran - US Navy Shirt - Mens Short Sleeve T Shirt - USAF Shirt - American Flag Patriotic Shirt - Black - XL
We The People Holsters$29.414.5★
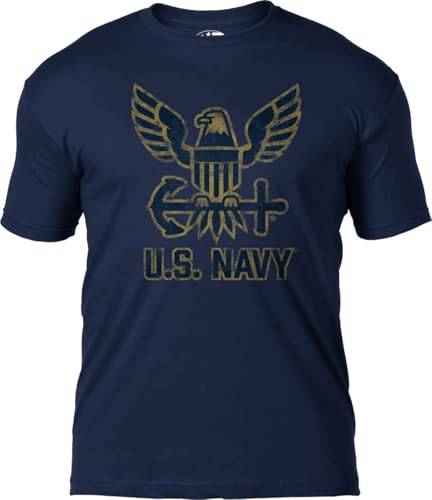
7.62 Design United States Navy Eagle Tee Shirt XX-Large
7.62 Design$15.174.6★
Demand & seasonality
Weekly Amazon search volume, last 104 weeks — +23.7% search growth over the last 90 days.Peak months: Nov, Dec · busiest ÷ quietest = 4.2×
Reviews
What buyers praise and complain about, mined from review topics.What buyers love
“Good quality, vivid colors”
“Fits as advertised”
“Good value”
“It's as pictured”
“Very comfortable”
“Nice design”
“the colors are vibrant”
“Gift bag”
“Quality all Cotton Ball Cap”
“Beautiful and not too heavy my husband loves it”
What buyers complain about
“Fit is weird”
“Low quality”
“The material is a bit thin”
“Gold color is a little fake looking”
“Not as described”
“Tired of cotton non stretch shirts”
“No pockets”
“Very disappointing as it was a gift”
“Not made in America”
“it wont last long”