native sunglasses
Worth a lookShows sweet-spot pricing room ($21.47–$97.11), but brand-locked demand (top 5 brands take 97% of clicks) keeps it on the watch list.
Price range
Incredible$21.47–$97.11cheapest to priciest tracked listing — scored on the share inside $15–$100
Avg price
Great$57.14avg listing price — sweet spot $15–$100
Growth
Great+61.0%90-day search growth — must beat 0% to launch
Competition
Great40%top-5 click share — an open shelf
Review moat
Good1,172.89avg incumbent reviews — the moat a new listing must climb
Quality gap
Good4.5★avg incumbent rating — lower means beatable quality
Returns
Okay4.6%return rate — above 6% kills the launch gate
Market size
Okay$101K$101K/yr · 95K searches
Conversion
Bad1.9%search→purchase rate — share of searches ending in a sale
Brand share
Bad97%top-5 brand share — brand-locked demand
Competition
Clicks spread well past the top 5 (40% combined) — an open shelf where new products get seen.Brands
9 rising
Sellers
18
Top-5 brand share
97%
Open market
2%
- Native90%
- WearMe Pro2%
- suoso2%
- Shady Rays2%
- ZENOTTIC1%
- B.N.U.S1%
- Open — no brand owns it (3 brands, 2%)
Product shelf
Each bubble is one product — market share against review moat; bubble size tracks estimated sales, color grades how beatable the incumbent looks.
All 36 tracked products in this niche — three views at once, no toggling.
Top sellers
by 90-day click share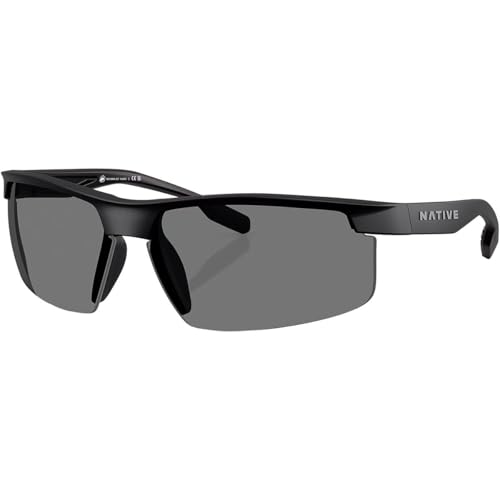
Native XD9048 Ridge-Runner Crest Sunglasses Matte Black/Grey Polarized 69 mm
Native$60.414.8★23 rev
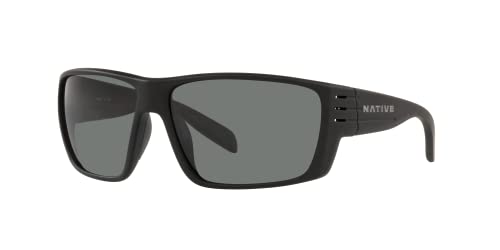
Native Man Sunglasses Matte Black Frame Grey Lenses 66MM
Native$59.044.0★29 rev
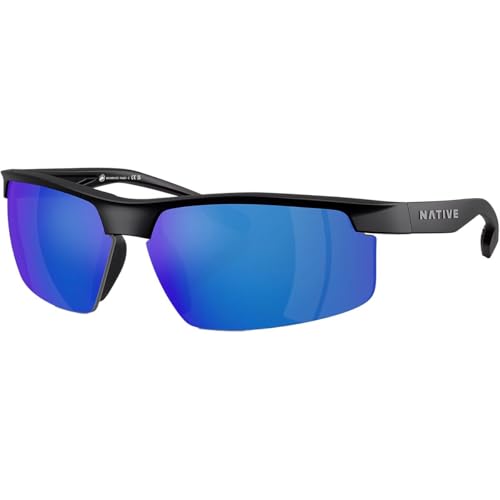
Native XD9048 Ridge-Runner Crest Sunglasses Matte Black/Blue Mirrored Polarized 69 mm
Native$62.454.8★23 rev
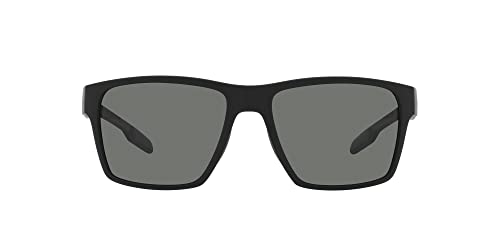
Native XD9041 Breck Sunglasses Matte Black/Grey Polarized 56 mm
Native$52.694.3★32 rev
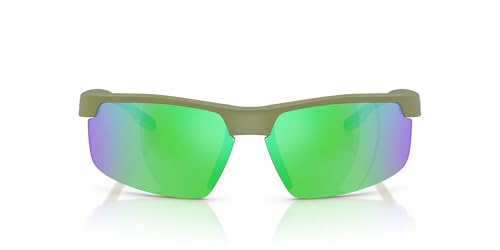
Native XD9048 Ridge-Runner Crest Sunglasses Forest Mist Green/Green Mirrored Polarized 69 mm
Native$48.314.8★23 rev
Newest
by launch date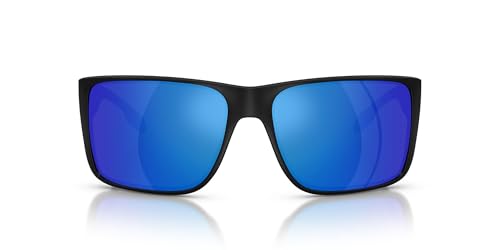
Native Eyewear Mens XD9049 Badlands XL Rectangular Sunglasses Matte Black/Blue Mirrored Polarized 62 mm
Native$53.423 rev
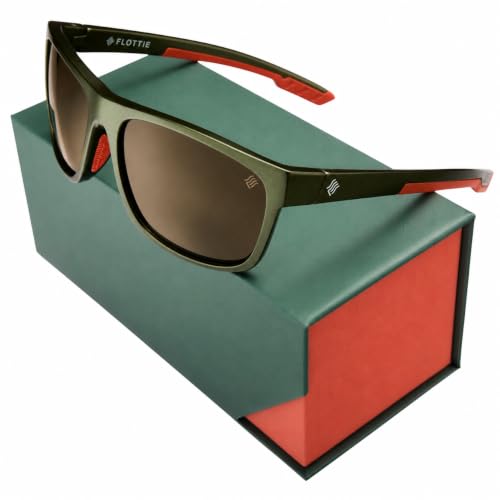
FLOTTIE ANCHOR Floating Polarized Fishing Sunglasses for Men and Women Lightweight UV400 sport for Driving Cycling Running
FLOTTIE$33.7973 rev
Native XD9048 Ridge-Runner Crest Sunglasses Forest Mist Green/Green Mirrored Polarized 69 mm
Native$48.3123 rev
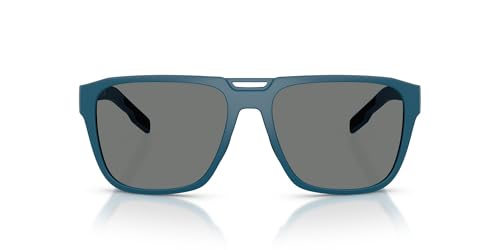
Native Mammoth Sunglasses Overland Blue/Grey Polarized 57 mm
Native$57.607 rev
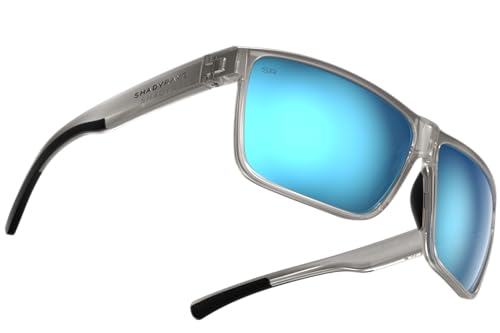
Shady Rays Cayman - Ocean Smoke/Blue Glacier Mirror Lens Standard Fit
Shady Rays$54.57104 rev
Trending
90-day click momentumFLOTTIE ANCHOR Floating Polarized Fishing Sunglasses for Men and Women Lightweight UV400 sport for Driving Cycling Running
FLOTTIE$33.794.6★
Shady Rays Cayman - Ocean Smoke/Blue Glacier Mirror Lens Standard Fit
Shady Rays$54.574.4★
Native Eyewear Mens XD9049 Badlands XL Rectangular Sunglasses Matte Black/Blue Mirrored Polarized 62 mm
Native$53.425.0★

suoso Sports Polarized Sunglasses for Men: Womens UV400 Protection Sun Glasses Wrap Around Goggles for Fishing Driving TR90
suoso$21.474.6★
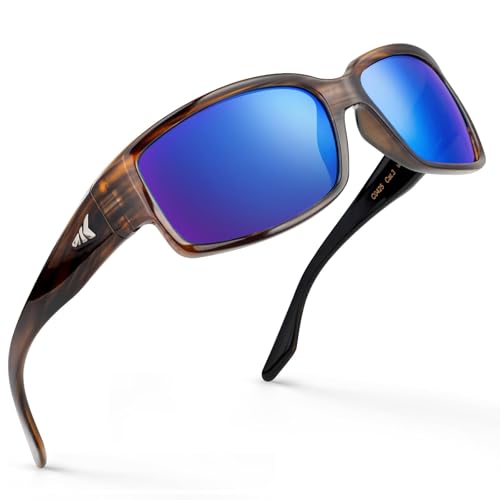
KastKing Skidaway Polarized Sport Sunglasses for Men and Women Ideal for Driving Fishing Cycling and Running UV Protection
KastKing$25.344.5★
Demand & seasonality
Weekly Amazon search volume, last 67 weeks — +61.0% search growth over the last 90 days.Peak months: Jun, Jul · busiest ÷ quietest = 2.7×
Reviews
What buyers praise and complain about, mined from review topics.What buyers love
“Good for the price”
“not too snug - they feel good”
“the glasses are high quality”
“Light, comfortable”
“love the color”
“Very light, polarized glasses”
“These were EXACTLY what I was looking for”
“Stylish look”
“The lenses are clear, crisp and cut the salt water well enough that I am able to identify a flounder in 2 feet of water”
“I love the design”
What buyers complain about
“Size runs small”
“Poor quality”
“I wanted blue”
“Lasted less than a year before snapping from the mildest of forces”
“RIP-OFF/ FALSE ADVERTISING Not Corning Glass”
“The materials on these glasses are absolutely nothing like what they used to be in Native glasses a decade ago”
“especially for the cost my expectations were pretty high”
“Ok, didn't work for my face”
“Fragile”
“They are ridged and not flexible”