dd214 hat
Worth a lookShows a thin review moat (27 avg reviews), but a failed launch gate (market size, growth, or returns) keeps it on the watch list.
Review moat
Incredible26.79avg incumbent reviews — the moat a new listing must climb
Returns
Incredible0.5%return rate — above 6% kills the launch gate
Quality gap
Great4.0★avg incumbent rating — lower means beatable quality
Competition
Great32%top-5 click share — an open shelf
Avg price
Great$15.50avg listing price — sweet spot $15–$100
Price range
Good$8.86–$29.72cheapest to priciest tracked listing — scored on the share inside $15–$100
Brand share
Okay77%top-5 brand share — brands hold most of the demand
Conversion
Okay2.8%search→purchase rate — share of searches ending in a sale
Growth
Bad-11.4%90-day search growth — must beat 0% to launch
Market size
Bad$38K$38K/yr · 86K searches
Competition
Clicks spread well past the top 5 (32% combined) — an open shelf where new products get seen.Brands
20 rising
Sellers
42
Top-5 brand share
77%
Open market
20%
- Generic45%
- koumpo14%
- JOYGIEE7%
- UASIMONSEN6%
- VIYAU5%
- LDLXLHTE3%
Product shelf
Each bubble is one product — market share against review moat; bubble size tracks estimated sales, color grades how beatable the incumbent looks.
All 48 tracked products in this niche — three views at once, no toggling.
Top sellers
by 90-day click share
DD-214 Army Veteran Hat Embroidered Patriotic Baseball Cap Patriotic Veteran Day Gifts for Retired Soldiers (Green)
koumpo$16.154.2★116 rev
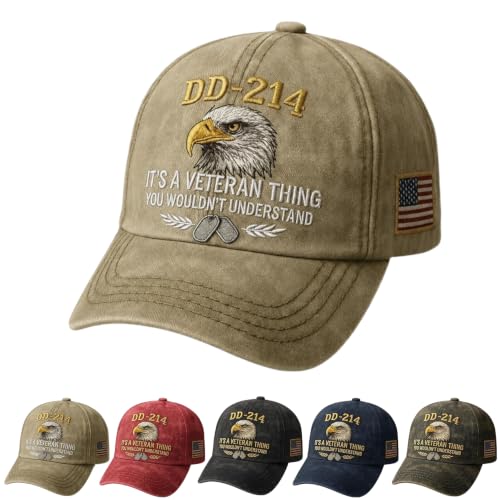
DD-214 Army Veteran Hat Vintage Adjustable Embroidered Eagle Patriotic Baseball Cap Veteran Day Gifts for Retired Soldiers Khaki
Generic$12.584.6★3 rev
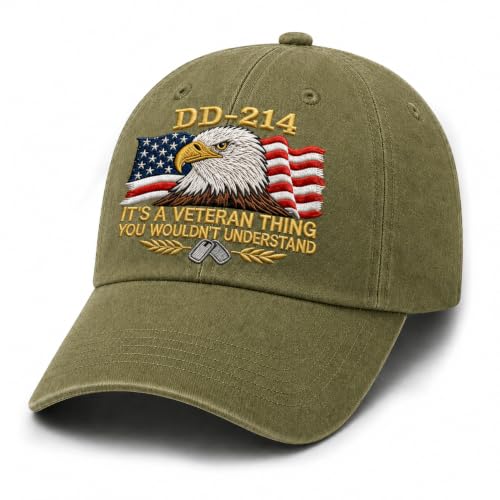
DD-214 Veteran Hat for Men Its a Veteran Thing You Wouldnt Understand Embroidered Patriotic Military Baseball Cap with Flag & Dog Tags Adjustable Fit (Military Green)
Generic$19.134.0★33 rev
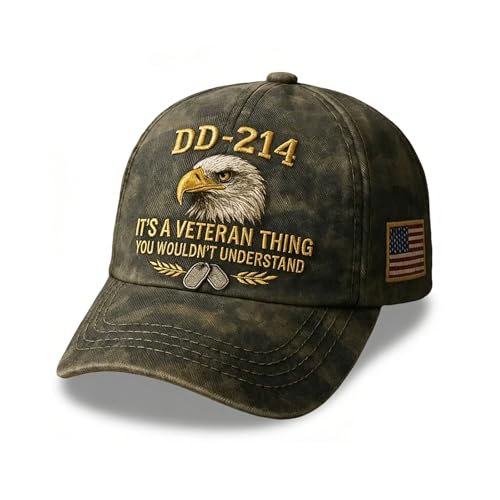
DD-214 Army Veteran Hat Vintage Adjustable Embroidered Badge Patriotic Cap Veteran Day Gifts Baseball Hat for Men Women
UASIMONSEN$12.234.2★15 rev
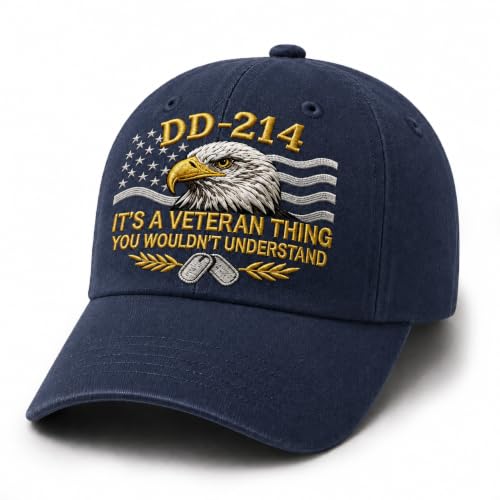
DD-214 Veteran Hat for Men DD-214 Embroidered Military Baseball Cap Veteran and Army Hats for Men Military Service Pride Gift Its a Veteran Thing (Navy Blue)
Generic$19.093.5★25 rev
Newest
by launch date
DD-214 Veteran 3D Embroidered Cap Adjustable Army Veteran Hats (Brown)
Generic$15.310 rev
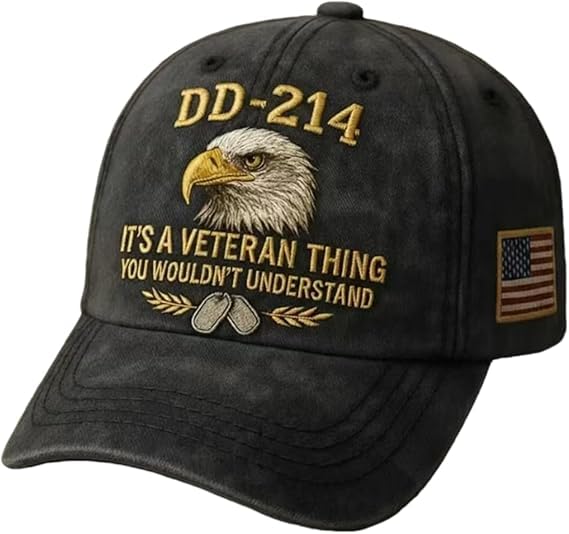
Army Veteran Hats for Men- Adjustable Embroidered Eagle Patriotic Hat Ideal Gift for Veterans & Soldiers (Black)
VIYAU$14.948 rev
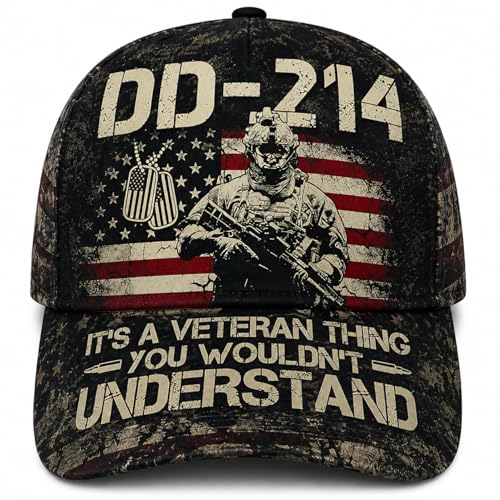
Never Underestimate an Old Man with A DD214 Hat Combat Boots Patriotic Vintage Baseball Cap Veteran Gifts Mens Green
Generic$13.820 rev
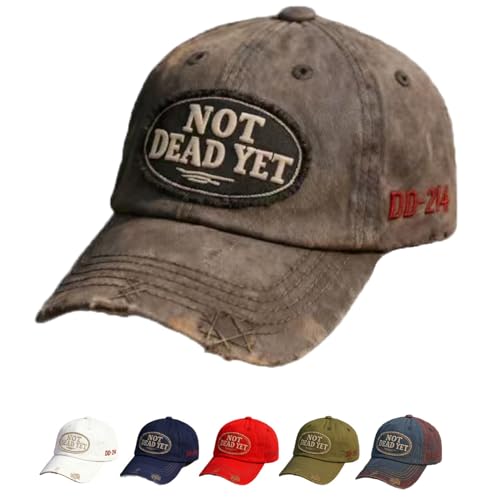
Veteran Hats Not Dead Yet Hat Embroidered DD-214 Baseball Cap Vintage Adjustable Baseball Hats for Military Veterans
UBNZESW$9.5914 rev
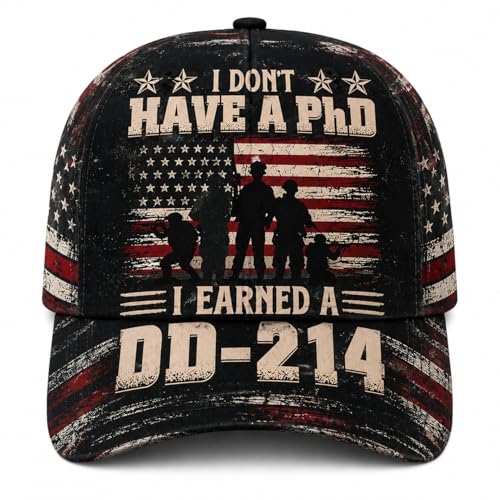
DD214 Hat Its A Veteran Thing Bald Eagle Patriotic US Flag Baseball Cap Military Retirement Gifts for Men Dad
Generic$13.740 rev
Trending
90-day click momentum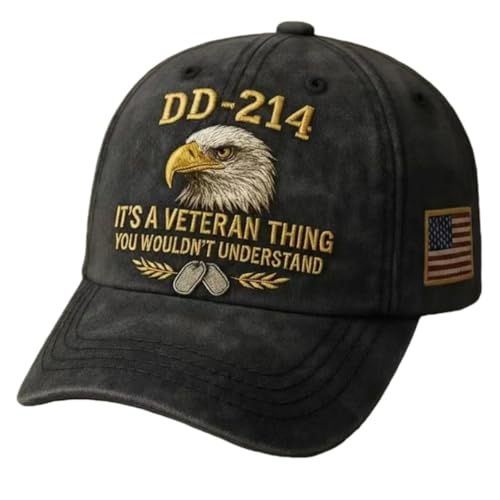
DD-214 Army Veteran Hat - Embroidered Patriotic Baseball Cap Patriotic Veteran Day Gifts for Retired Soldiers (Black)
JOYGIEE$14.954.8★
DD-214 Veteran 3D Embroidered Cap Adjustable Army Veteran Hats (Brown)
Generic$15.310.0★
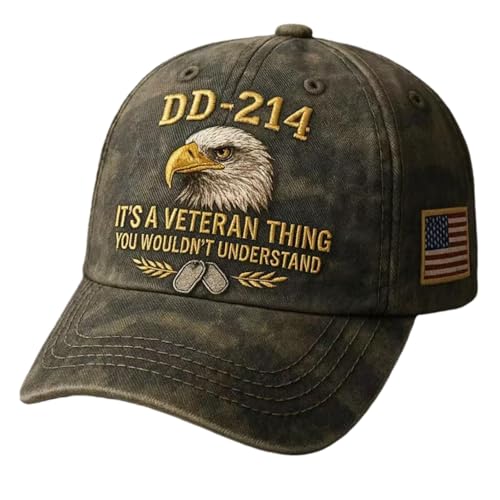
DD-214 Army Veteran Hat - Embroidered Patriotic Baseball Cap Patriotic Veteran Day Gifts for Retired Soldiers (Camouflage)
JOYGIEE$14.914.8★
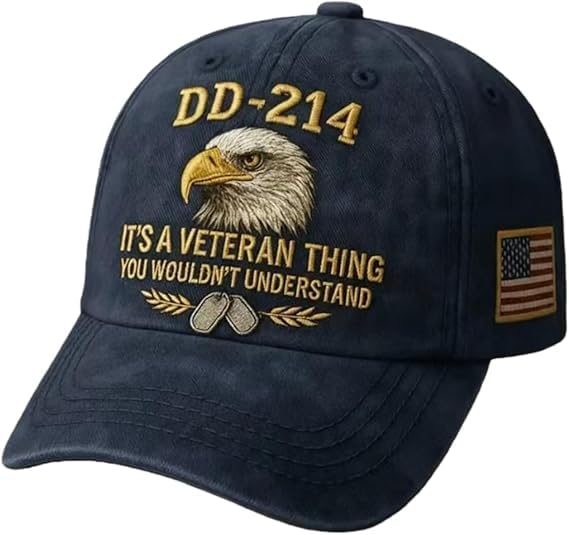
DD-214 Army Veteran Hat Embroidered Patriotic Baseball Cap Patriotic Veteran Day Gifts for Retired Soldiers (Blue)
Generic$14.925.0★
Never Underestimate an Old Man with A DD214 Hat Combat Boots Patriotic Vintage Baseball Cap Veteran Gifts Mens Green
Generic$13.820.0★
Demand
Weekly Amazon search volume, last 27 weeks — -11.4% search growth over the last 90 days.Reviews
What buyers praise and complain about, mined from review topics.What buyers love
“Its beautifully made”
“The Cap fit great”
“Colors are great”
“Looks like the picture”
“Good value for the price”
“The fabric is sturdy”
“Well constructed”
“Great gift for your Veterans”
“Excellent style very nice job”
What buyers complain about
“False Advertising”
“Crap Product, not worth the money”
“It arrived flattened”
“Not the same color”
“the material they make the hat from is very thin”
“Not a good fit”
“Very flimsy”
“The price is deplorable”
“wrinkled hat came in sandwich baggy”
“That's how poorly made it is”