brown leather belt
Worth a lookShows a fragmented shelf (top 5 take 20% of clicks), but weak search conversion (1.7%) keeps it on the watch list.
Competition
Great20%top-5 click share — an open shelf
Avg price
Great$20.96avg listing price — sweet spot $15–$100
Price range
Great$8.34–$71.02cheapest to priciest tracked listing — scored on the share inside $15–$100
Growth
Good+50.1%90-day search growth — must beat 0% to launch
Brand share
Good69%top-5 brand share — brands hold most of the demand
Returns
Okay4.1%return rate — above 6% kills the launch gate
Quality gap
Okay4.5★avg incumbent rating — lower means beatable quality
Market size
Okay$129K$129K/yr · 364K searches
Review moat
Bad7,406.63avg incumbent reviews — the moat a new listing must climb
Conversion
Bad1.7%search→purchase rate — share of searches ending in a sale
Competition
Clicks spread well past the top 5 (20% combined) — an open shelf where new products get seen.Brands
34 rising
Sellers
81
Top-5 brand share
69%
Open market
27%
- CHAOREN34%
- Nike16%
- BULLIANT10%
- adidas5%
- WOLFANT4%
- VATAN4%
Product shelf
Each bubble is one product — market share against review moat; bubble size tracks estimated sales, color grades how beatable the incumbent looks.
All 108 tracked products in this niche — three views at once, no toggling.
Top sellers
by 90-day click share
Nike Mens 3 Pack Golf Web Belt White/Gray/Navy One Size
Nike$19.484.5★15,206 rev
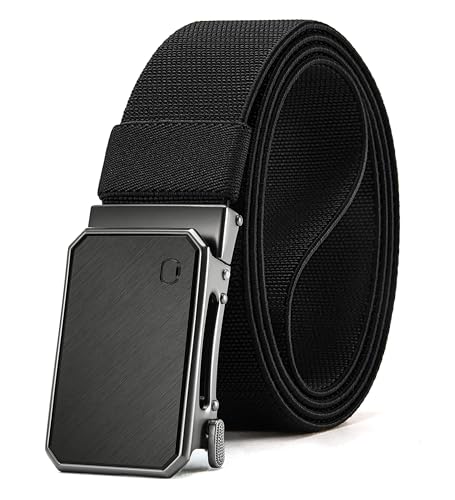
CHAOREN Mens Ratchet Belt 1.5 Stretch Nylon Belts for Casual Work Golf Adjustable Fit for Everyday Comfort
CHAOREN$16.374.5★110 rev
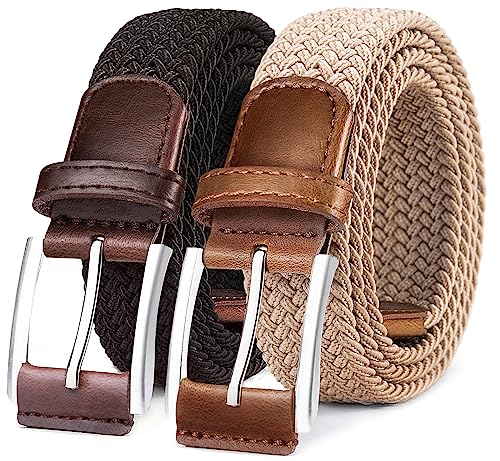
BULLIANT Belt for Men 2Pack Mens Gift Stretch Braided Web Belt Elastic for Casual Golf Jeans 1 3/8(Black/Beige 30-34 Waist Adjustable)
BULLIANT$18.084.6★18,409 rev

CHAOREN Mens Belts Casual for Jeans - Full-Grain Leather Durable Cowhide
CHAOREN$14.784.6★2,232 rev
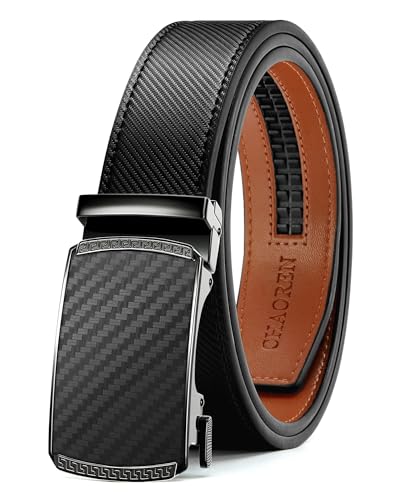
CHAOREN Mens Belt Leather Ratchet Belt - Customizable Fit Effortless Style (35mm)
CHAOREN$14.314.6★49,874 rev
Newest
by launch date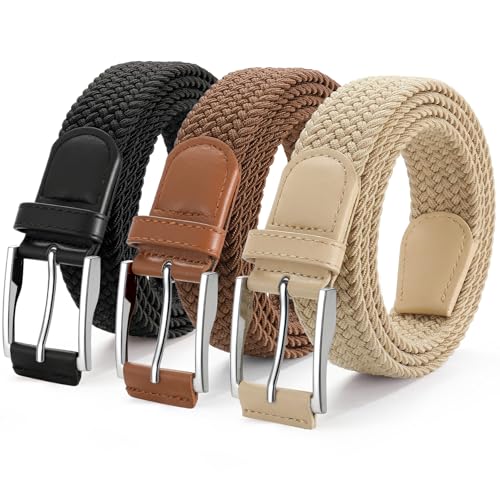
JASGOOD Stretchy Golf Belts for Men 3-Pack Elastic Braided Belt for Golf Pants Jeans 1 3/8 Casual Woven Mens Belt Black/Beige/Brown Belt
JASGOOD$20.2545 rev
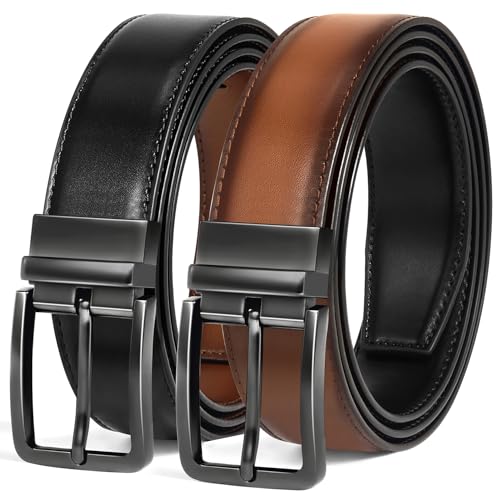
DENGFENGZHE Mens Belt Reversible Belt Men 1 Piece - 1 3/8 Leather Dress Belt - Trim to Fit for Elegant Style (Black/Tan 34-36 Waist Adjustable)
DENGFENGZHE$11.4687 rev
CHAOREN Mens Ratchet Belt 1.5 Stretch Nylon Belts for Casual Work Golf Adjustable Fit for Everyday Comfort
CHAOREN$16.37110 rev
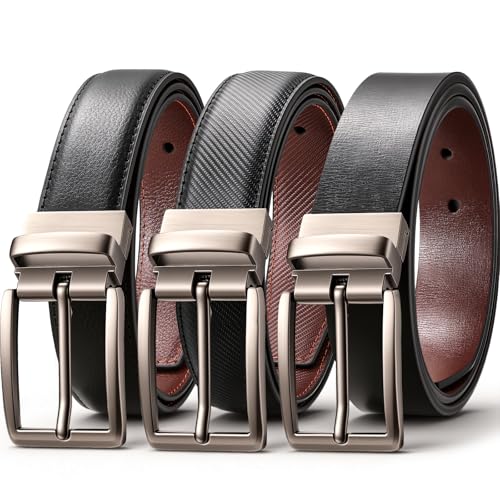
LMUGOOS 3 Pack Mens Belt Reversible Genuine Leather Belts - Adjustable & Cuttable 1.2 for Dress Business Casual & Jeans | Ideal Gift for Men Dad Husband on Birthday Anniversary & Fathers Day
LMUGOOS$20.37130 rev

Perry Ellis Portfolio Reversible Leather Dress Belt for Men with Stitch and Heat Crease Lugg3 34
Perry Ellis$28.26116 rev
Trending
90-day click momentum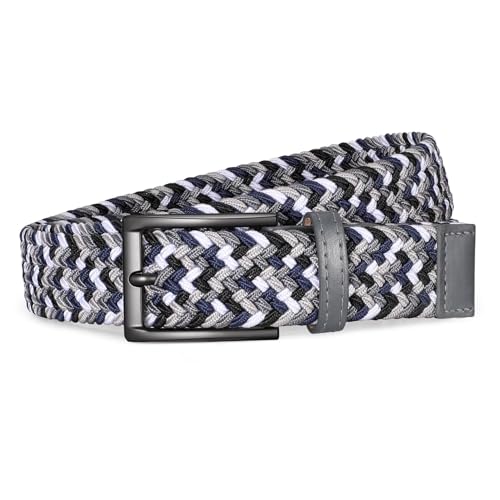
JASGOOD Mens Belt-Stretch Braided Woven Golf Belt for Men and Women Elastic Fabric Canvas Belts for Jeans Pants Shorts Casual Work Cloth Belt 1 3/8 Multicolored
JASGOOD$10.534.2★
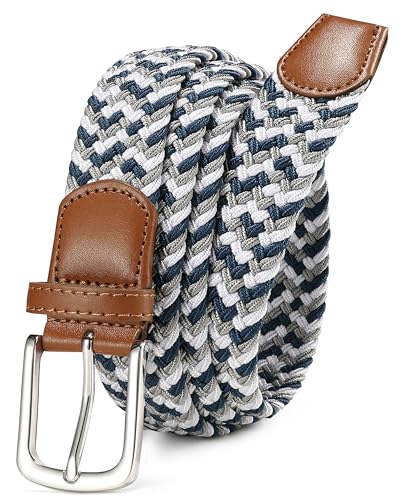
CHAOREN Stretch Mens Belt - Braided Elastic Golf Belt for Men 1 3/8- Fits Casual Jeans & Shorts
CHAOREN$15.114.5★
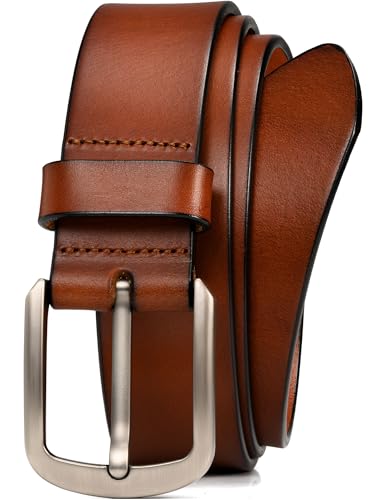
WOLFANT 1.5 Top Full Grain Leather Belt for Men in Gift Box 100% Italian Real Solid Leather
WOLFANT$37.944.7★
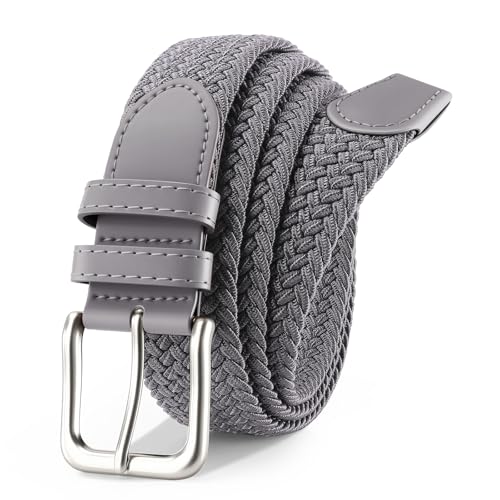
Mens Belt Braided Stretch Belt for Men Golf Pants Casual Jeans (Light Gray)
YA BELT$10.334.5★
CHAOREN Mens Ratchet Belt 1.5 Stretch Nylon Belts for Casual Work Golf Adjustable Fit for Everyday Comfort
CHAOREN$16.374.5★
Demand & seasonality
Weekly Amazon search volume, last 104 weeks — +50.1% search growth over the last 90 days.No pronounced peak months · busiest ÷ quietest = 1.6×
Reviews
What buyers praise and complain about, mined from review topics.What buyers love
“Solid build quality”
“fit is accurate”
“Great purchase for the price”
“Easy to adjust”
“High quality leather”
“They still look brand new”
“As Advertised”
“it is so easy to operate”
“its comfortable to wear”
“Its an excellent-quality strap: durable, well-made, and comfortable”
What buyers complain about
“broke after a week”
“TOO LONG”
“Low Quality”
“The strap broke in about two days”
“poor quality leather”
“False advertising”
“Buckle Broken”
“The length was slight longer than I needed”
“not good Elastic”
“Not user friendly”