ankle compression socks for women
Worth a lookShows a sweet-spot price point ($16.96 avg), but a deep review moat (6,894 avg reviews) keeps it on the watch list.
Avg price
Great$16.96avg listing price — sweet spot $15–$100
Price range
Great$7.17–$45.07cheapest to priciest tracked listing — scored on the share inside $15–$100
Competition
Good42%top-5 click share — leaders hold, buyers still browse
Market size
Good$768K$768K/yr · 2.2M searches
Quality gap
Good4.4★avg incumbent rating — lower means beatable quality
Returns
Good2.7%return rate — above 6% kills the launch gate
Growth
Good+21.4%90-day search growth — must beat 0% to launch
Conversion
Okay2.1%search→purchase rate — share of searches ending in a sale
Brand share
Okay89%top-5 brand share — brands hold most of the demand
Review moat
Bad6,894.43avg incumbent reviews — the moat a new listing must climb
Competition
The top 5 products take 42% of clicks — established leaders, but buyers still shop beyond them.Brands
12 falling
Sellers
18
Top-5 brand share
89%
Open market
8%
- PAPLUS37%
- Viasox29%
- IRAMY18%
- Iseasoo3%
- LEVSOX2%
- Dr. Motion2%
- Open — no brand owns it (6 brands, 8%)
Product shelf
Each bubble is one product — market share against review moat; bubble size tracks estimated sales, color grades how beatable the incumbent looks.
All 35 tracked products in this niche — three views at once, no toggling.
Top sellers
by 90-day click share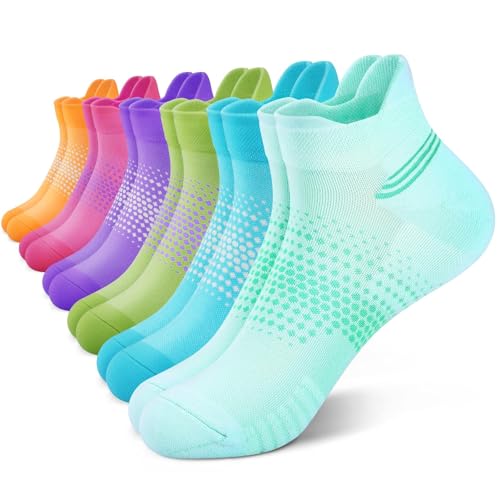
PAPLUS 6 Pairs Ankle Compression Socks for Women Running Socks with Heel Tab Cushioned Low Cut Athletic Socks
PAPLUS$18.964.5★3,266 rev
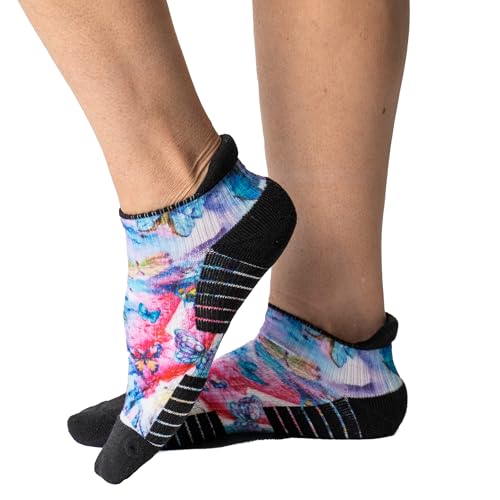
Viasox Ankle Compression Socks for Women & Men 14 mmHg Support Improves Circulation Extra Cushioned (US Alpha X-Large Regular Regular Butterfly)
Viasox$18.914.1★1,826 rev
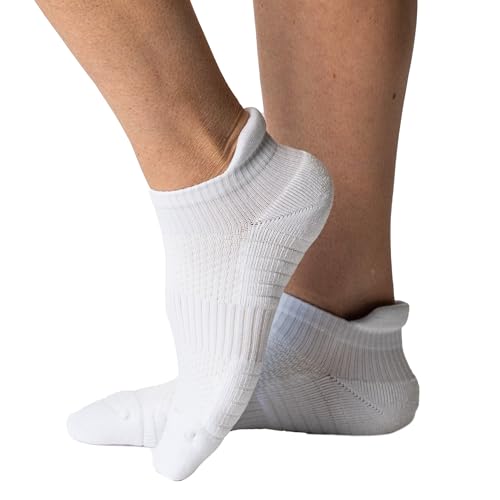
Viasox Ankle Compression Socks for Women & Men 14 mmHg Support Improves Circulation Extra Cushioned (US Alpha Medium Regular Regular White)
Viasox$18.454.1★1,826 rev

IRAMY Ankle Compression Socks for Women Men Plantar Fasciitis Relief Cushioned Athletic Running Socks 3 Pairs
IRAMY$7.464.5★2,661 rev
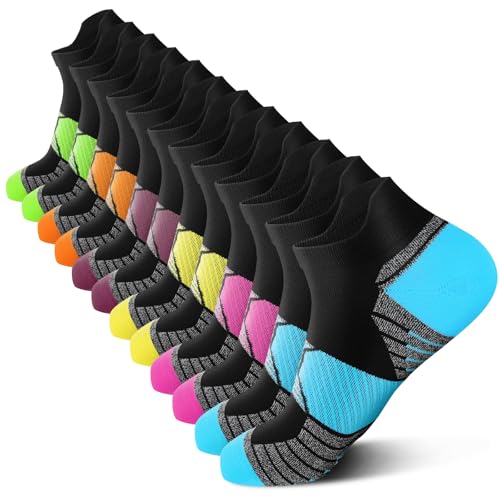
PAPLUS Compression Running Socks Women (6 Pairs) Ankle Athletic Socks Low Cut with Arch Support
PAPLUS$16.494.5★11,399 rev
Newest
by launch date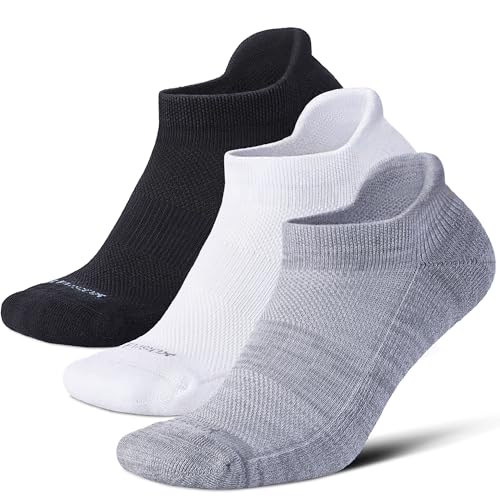
LEVSOX Ankle Compression Socks for Women and Men Bamboo Viscose Low Cut Cushioned Athletic Running Socks
LEVSOX$18.70102 rev
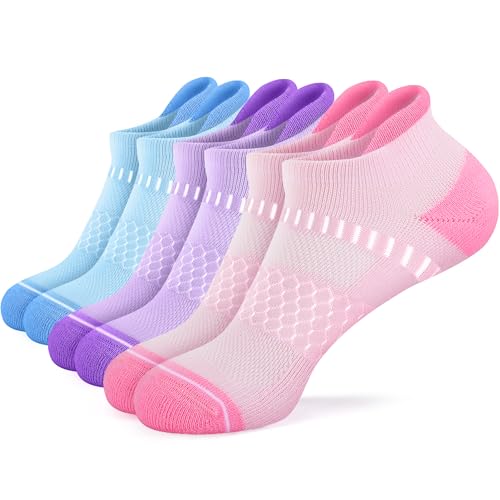
IRAMY Light Compression Socks for Women Arch Support Athletic Cushioned Anti-Blister Comfort Running Ankle Socks 5 Pairs
IRAMY$7.6286 rev
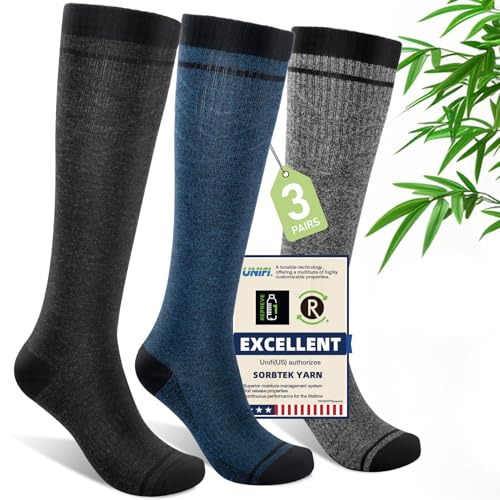
Iambamboo Mens Compression Socks for Men Women (3 Pairs) 15-20 mmHg Bamboo Viscose Knee High Sock for Travel L/XL (Dark Gray&Steel Blue&Light Gray)
Iambamboo$19.431,419 rev
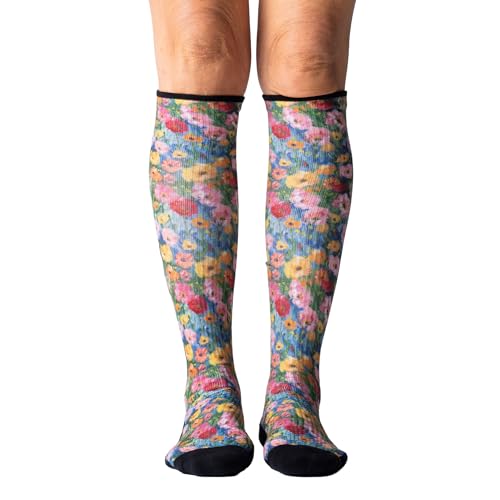
Viasox Compression Socks for Women and Men Knee High Socks 12-15 mmhg Circulation Support for Flight Travel Daily (Wild Flower X-Large)
Viasox$18.88734 rev
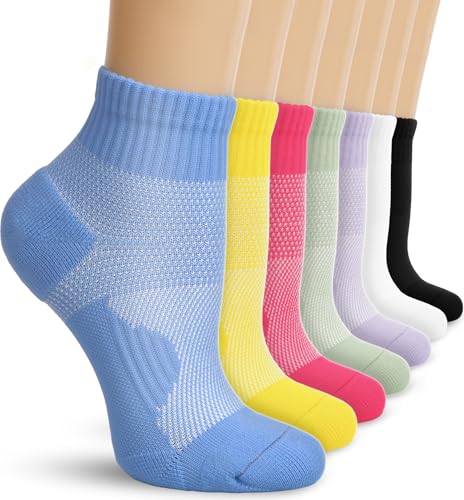
DHSO 7 Pairs Cushioned Ankle Compression Socks for Women Running Wicking Socks with Arch Support(Mix of Colors Small-Medium)
DHSO$15.04223 rev
Trending
90-day click momentumLEVSOX Ankle Compression Socks for Women and Men Bamboo Viscose Low Cut Cushioned Athletic Running Socks
LEVSOX$18.704.2★
IRAMY Light Compression Socks for Women Arch Support Athletic Cushioned Anti-Blister Comfort Running Ankle Socks 5 Pairs
IRAMY$7.624.4★

IRAMY Ankle Compression Socks for Women Men Plantar Fasciitis Relief Cushioned Athletic Running Socks 3 Pairs
IRAMY$11.524.5★
DHSO 7 Pairs Cushioned Ankle Compression Socks for Women Running Wicking Socks with Arch Support(Mix of Colors Small-Medium)
DHSO$15.044.4★
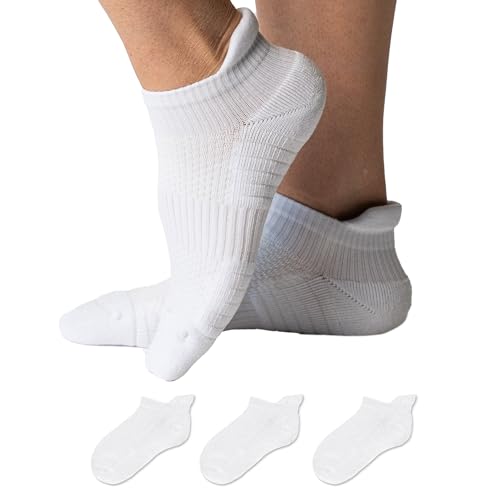
Viasox Ankle Compression Socks for Women & Men 3 Pack 14 mmHg Support Improves Circulation Extra Cushioned (White S/M)
Viasox$45.074.5★
Demand & seasonality
Weekly Amazon search volume, last 104 weeks — +21.4% search growth over the last 90 days.Peak months: Jul, Aug · busiest ÷ quietest = 2.3×
Reviews
What buyers praise and complain about, mined from review topics.What buyers love
“It's comfortable”
“not too tight”
“Comfortable good amount of compression”
“Nice looking and seem well made”
“Great deal”
“Comfortable and soft”
“Colors are cute”
“Ease of use”
“As advertised”
“Effective”
What buyers complain about
“Terrible fit”
“Compression was very weak”
“they really did not provide any pain relief”
“That are too thick to fit my shoes”
“Didnt last”
“Not worth the money”
“Very uncomfortable to wear”
“No good dont do anything by my foot”
“Too tight on ankles”
“I just have some swelling around my ankles”