tmobile
Skip it52/100a small market ($660K/yr) — tmobile doesn't clear our bar today.
Market/yr
$660K
Growth (1y)
+90.6%
Products
32
Brands
4
was 2 a year ago
Sellers
174
Price range
$18.12–$168.48
Returns
5.2%
Rating
4.2★
Skip it
Scored 52/100 across market size, growth, competition, quality gap, and returns.
Demand
Weekly Amazon search volume, last 44 weeks — +90.6% year over year.Competition
- AT&T63%
- Samsung34%
- Motorola2%
- AT&T Prepaid1%
- Other0%
The top 5 products take 49% of clicks — established leaders, but buyers still shop beyond them. 4 brands and 174 sellers compete here.
Brands
4 rising
was 2 a year ago
Sellers
174
Top 5 brand share
100%
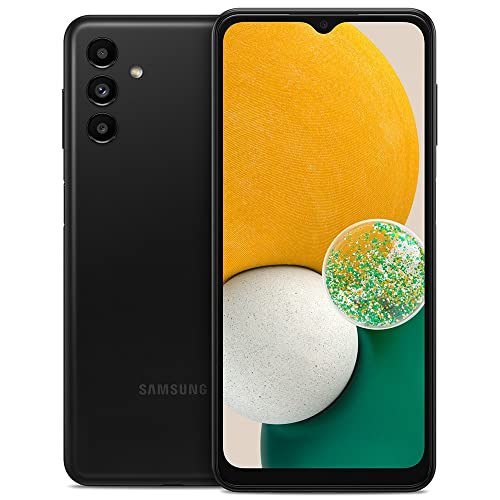
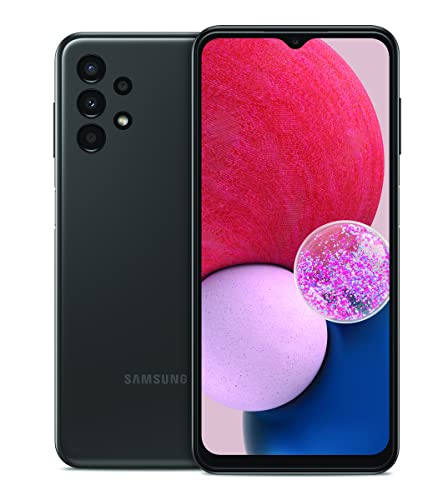
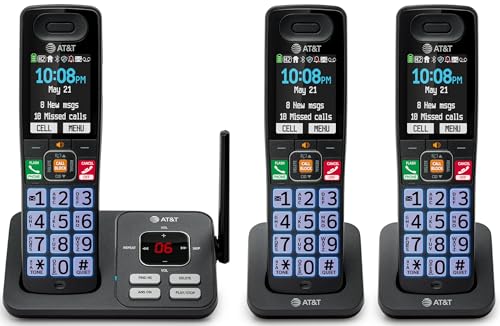
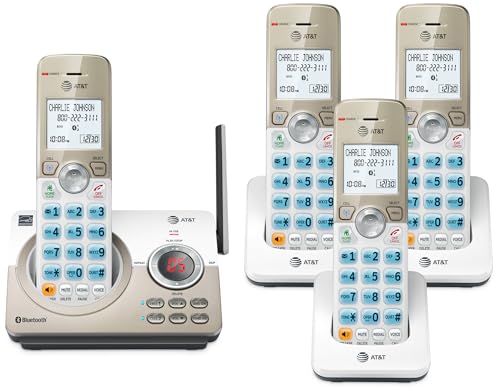


Product shelf
All 32 tracked products in this niche.

Samsung Galaxy A13 5G 64GB Black - Unlocked (GSM Only) (Renewed)
Samsung
$86.924.0★2,227 reviews
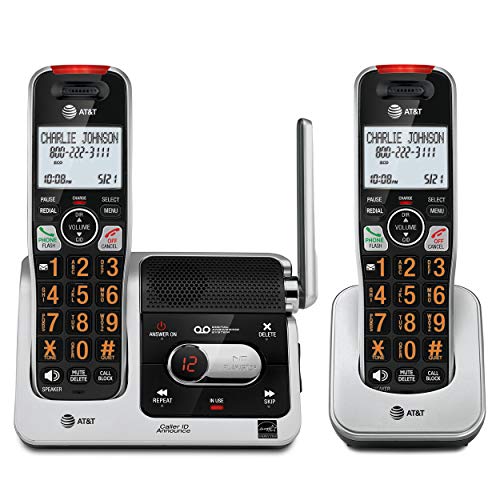
AT&T BL102-2 DECT 6.0 2-Handset Cordless Phone for Home with Answering Machine Call Blocking Caller ID Announcer Audio Assist Intercom and Unsurpassed Range Silver/Black
AT&T
$57.824.2★33,312 reviews
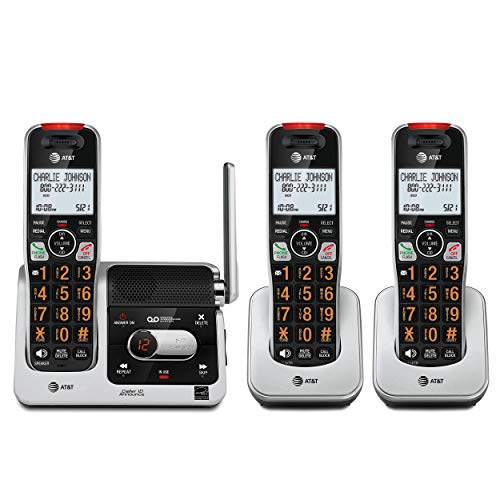
AT&T BL102-3 DECT 6.0 3-Handset Cordless Phone for Home with Answering Machine Call Blocking Caller ID Announcer Audio Assist Intercom and Unsurpassed Range Silver/Black
AT&T
$78.934.2★33,312 reviews

Samsung Galaxy A13 32GB Black - Unlocked (Renewed)
Samsung
$86.784.1★1,706 reviews
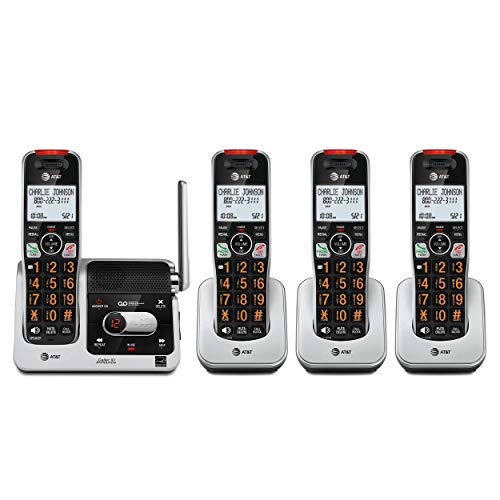
AT&T BL102-4 DECT 6.0 4-Handset Cordless Phone for Home with Answering Machine Call Blocking Caller ID Announcer Audio Assist Intercom and Unsurpassed Range Silver/Black
AT&T
$105.274.2★33,312 reviews

AT&T DL72219 DECT 6.0 2-Handset Cordless Phone for Home with Connect to Cell Call Blocking 1.8 Backlit Screen Big Buttons intercom and Unsurpassed Range
AT&T
$53.324.2★15,271 reviews
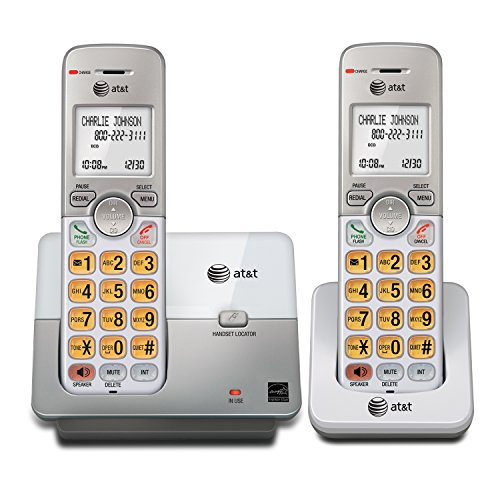
AT&T EL51203 DECT 6.0 2-Handset Cordless Phone with Full-Duplex Speakerphone Backlit Display & Lighted Keypad Caller ID/Call Waiting Intercom ECO Mode
AT&T
$42.534.3★37,544 reviews

AT&T GL2101 DECT 6.0 Cordless Home Phone with Call Block Caller ID Full-Duplex Handset Speakerphone 2 White Backlit Display Lighted Keypad (Graphite & Black)
AT&T
$26.464.4★2,737 reviews
Reviews
What buyers praise and complain about, mined from review topics.What buyers love
“Great value”
“Excellent Product”
“easy to hold”
“True to picture”
“Easy to set up”
“It works perfectly”
“Battery life is solid”
“Sound quality is excellent”
“everything has been running smoothly”
“The 2-inch white display is easy to read”
What buyers complain about
“Not working properly”
“the quality is shocking”
“broke within a year”
“Not compatible with”
“the bad connectivity”
“don't charge”
“Low battery life”
“BAD SOUND”
“Bad instructions”
“Hard to read”
Top return reasons
- Compatibility-Overall15%
- Functionality-Overall15%
- Connectivity-Overall9%
- Advertised Vs Actual Product7%
- Charging6%
- Value For Money6%
- Audio Quality4%
- Size-Overall4%
- Defective Material/Parts3%
- Computation Performance3%