t mobile
Skip it37/100a concentrated shelf (top 5 take 89% of clicks) — t mobile doesn't clear our bar today.
Market/yr
$140K
Growth (1y)
+110.9%
Products
9
Brands
4
was 9 a year ago
Sellers
47
Price range
$9.57–$141.01
Returns
4.9%
Rating
3.9★
Skip it
Scored 37/100 across market size, growth, competition, quality gap, and returns.
Competition
- T-Mobile82%
- Samsung8%
- Wingtech6%
- SIMBROS4%
- Other0%
The top 5 products capture 89% of clicks — a locked-up shelf that new listings rarely crack. 4 brands and 47 sellers compete here.
Brands
4 falling
was 9 a year ago
Sellers
47
Top 5 brand share
100%
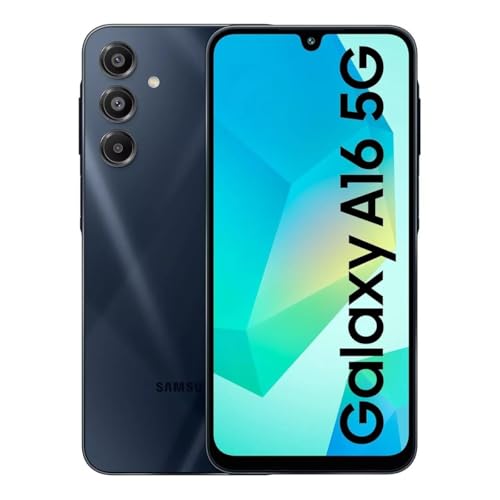
Product shelf
All 9 tracked products in this niche.
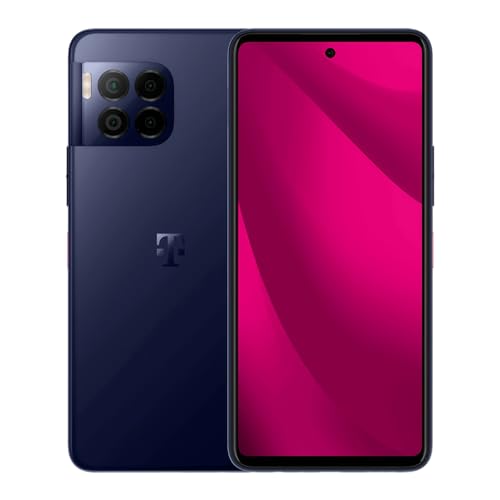
T-Mobile Revvl 7 Pro 5G Unlocked Smartphone 256GB Azurite Blue
T-Mobile
$128.584.0★238 reviews

T-Mobile REVVL V+ 5G Android 64GB Smartphone - Nebula Black (Renewed) (T-Mobile Unlocked)
T-Mobile
$86.143.9★635 reviews
Wingtech Revvl 7 5G TMRV075G T-Mobile Unlocked 128GB Arctic Gray (Renewed)
Wingtech
$71.023.8★130 reviews

Samsung Galaxy A15 5G 128GB Blue Black - Locked to T-Mobile (Renewed)
Samsung
$93.324.1★871 reviews
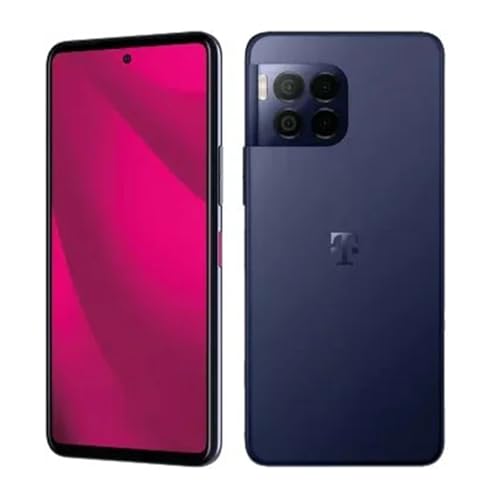
T-Mobile Revvl 7 Pro 5G Unlocked Smartphone 256GB Azurite Blue (Renewed)
T-Mobile
$103.693.9★55 reviews
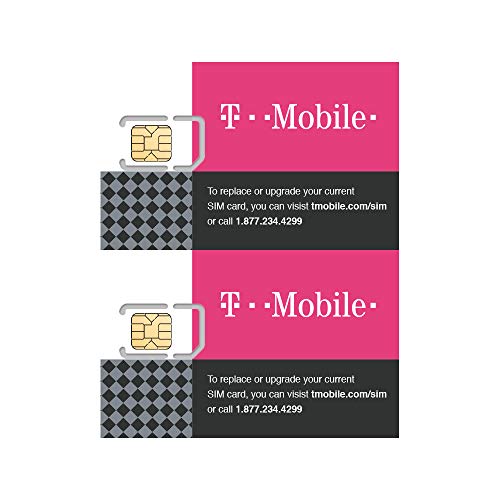
(2 Pack) Authentic Official T-Mobile SIM Card Micro/Nano/Standard GSM 4G/3G/2G LTE Prepaid/Postpaid Starter Kit Unactivated Talk Text Data & Hotspot
T-Mobile
$14.314.0★2,853 reviews
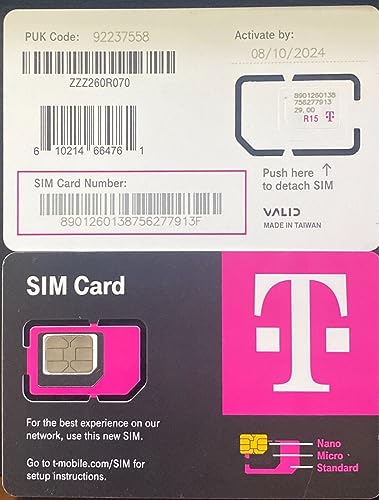
T-Mobile SIM Card R15 5G 4G LTE TMobile Triple Cut Nano Micro 3 in 1 Ultimate TMO Starter Pack with Simbros Simkey to Remove the sim Tray on Any Device!
SIMBROS
$9.574.0★686 reviews

T-Mobile Prepaid SIM Card Unlimited Talk Text and Data in USA with 5GB Data in Canada and Mexico for 30 days
T-Mobile
$27.753.4★124 reviews
Reviews
What buyers praise and complain about, mined from review topics.What buyers love
“Worth the price”
“Very well made item”
“Accurate description”
“It works”
“Easy to use”
“Durable”
“good battery life”
“Works perfect for T-mobile and Metro PCs”
“Perfect condition and it connected very well to my new service plan”
“great design”
What buyers complain about
“It barely works”
“Phone listed a T-mobile compatible, it wasn't”
“Don't waste your money”
“it won't charge the phone”
“Reception issues”
“The battery only lasts about 4 hours”
“Within 3 days of getting the phone it completely died”
“I broke the screen”
“not as good as previous models”
“it is an refurbished phone”
Top return reasons
- Compatibility-Overall16%
- Connectivity-Overall16%
- Functionality-Overall15%
- Advertised Vs Actual Product6%
- Charging5%
- Value For Money5%
- Display-Overall5%
- Touch Screen5%
- Defective Material/Parts3%
- Software/Application3%