samsung galaxy s10e
Launch it63/100samsung galaxy s10e clears our launch bar: a $3.0M/yr market growing +84.2% with returns at 4.7%.
Market/yr
$3.0M
Growth (1y)
+84.2%
Products
38
Brands
2
was 2 a year ago
Sellers
126
Price range
$105.02–$802.90
Returns
4.7%
Rating
4.2★
Launch it
Scored 63/100 across market size, growth, competition, quality gap, and returns.
Demand
Weekly Amazon search volume, last 103 weeks — +84.2% year over year.Seasonality
Monthly demand index across the year — 1.00 is average.Peak months: Nov, Dec · busiest ÷ quietest = 2.0×
Competition
- Samsung99%
- SAMSUNG1%
Clicks spread well past the top 5 (40% combined) — an open shelf where new products get seen. 2 brands and 126 sellers compete here.
Brands
2 flat
was 2 a year ago
Sellers
126
Top 5 brand share
100%




Product shelf
All 38 tracked products in this niche.

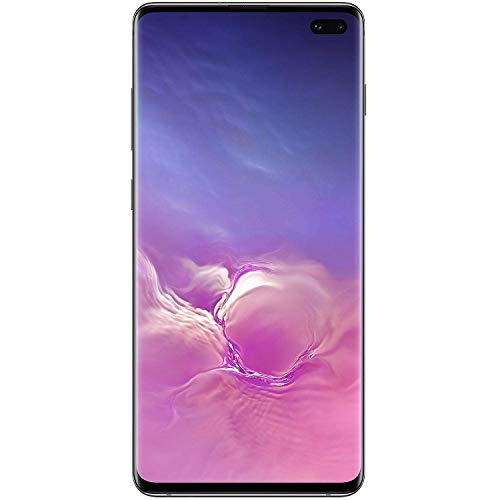
Samsung Galaxy S10 128GB + 6GB RAM Prism Black - Unlocked (Renewed)
Samsung
$154.544.3★660 reviews

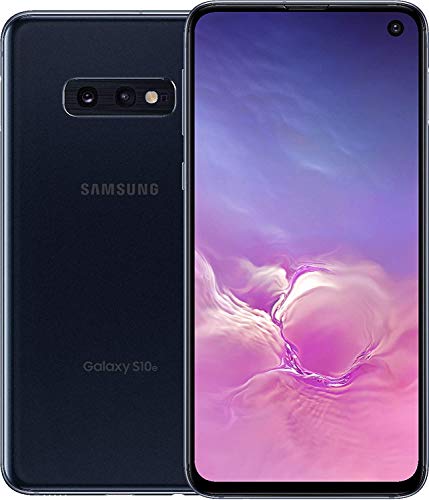
Samsung Galaxy S10e 128GB Prism Black - Unlocked (Renewed)
Samsung
$137.494.2★322 reviews
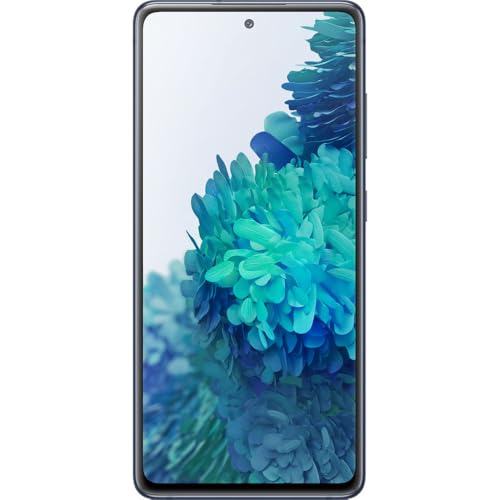
Samsung Galaxy S20 FE 5G 128GB Cloud Navy - Unlocked (Renewed)
Samsung
$144.533.9★5,532 reviews

Samsung Galaxy S20 Ultra 128GB Cosmic Black - Fully Unlocked (Renewed)
Samsung
$209.833.9★2,483 reviews
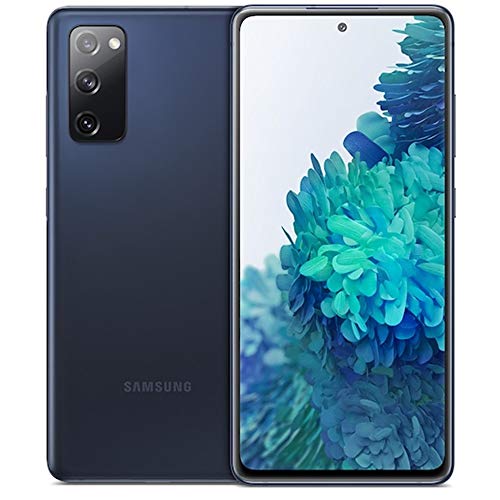
Samsung Galaxy S20 FE 5G 128GB + 6GB RAM Cloud Navy - Unlocked (Renewed)
Samsung
$144.654.0★2,283 reviews
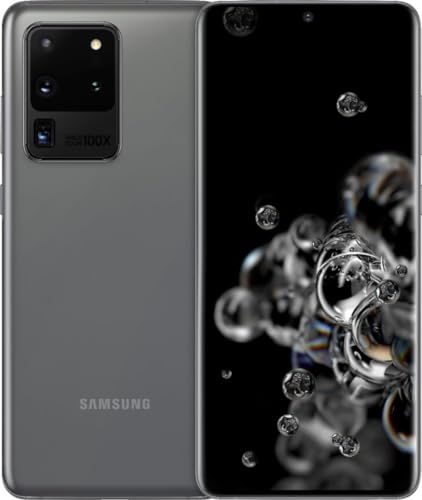
Samsung Galaxy S20 Ultra 128GB Cosmic Gray - Fully Unlocked (Renewed)
Samsung
$212.664.0★2,358 reviews

SAMSUNG Galaxy S10+ Plus (128GB 8GB) 6.4 AMOLED Snapdragon 855 IP68 Water Resistant 4G LTE (Fully Unlocked US Model for T-Mobile AT&T Verizon Global) G975U1 (Wireless Charger Bundle Black)
Samsung
$321.463.6★44 reviews

Samsung Galaxy S20 5G 128GB Cosmic Gray - Unlocked (Renewed)
Samsung
$167.234.0★3,904 reviews
Reviews
What buyers praise and complain about, mined from review topics.What buyers love
“The screen quality is good”
“Value for money”
“Just like new”
“Just what I needed”
“Battery life is good”
“decent display”
“Worked great for a little while”
“Awesome size”
“Amazing camera”
“charging is fast enough”
What buyers complain about
“Broke quickly”
“It will not hold a charge”
“Battery does not work”
“Doesn't work”
“could not get the device to connect”
“Definitely not excellent quality”
“FALSE ADVERTISING”
“I understood it would not be brand new”
“said that my sim wasn't compatible”
“App malfunctions”
Top return reasons
- Connectivity-Overall11%
- Functionality-Overall11%
- Charging8%
- Compatibility-Overall8%
- Advertised Vs Actual Product8%
- Touch Screen6%
- Value For Money6%
- Size-Overall6%
- Display-Overall5%
- Battery Life5%