samsung a14
Skip it42/100a concentrated shelf (top 5 take 73% of clicks) — samsung a14 doesn't clear our bar today.
Market/yr
$664K
Growth (1y)
+43.0%
Products
15
Brands
2
was 2 a year ago
Sellers
135
Price range
$64.91–$134.62
Returns
4.7%
Rating
4.1★
Skip it
Scored 42/100 across market size, growth, competition, quality gap, and returns.
Demand
Weekly Amazon search volume, last 104 weeks — +43.0% year over year.Seasonality
Monthly demand index across the year — 1.00 is average.Peak months: Oct, Nov, Dec · busiest ÷ quietest = 3.3×
Competition
- Samsung97%
- Tracfone3%
- Other0%
The top 5 products capture 73% of clicks — a locked-up shelf that new listings rarely crack. 2 brands and 135 sellers compete here.
Brands
2 flat
was 2 a year ago
Sellers
135
Top 5 brand share
100%
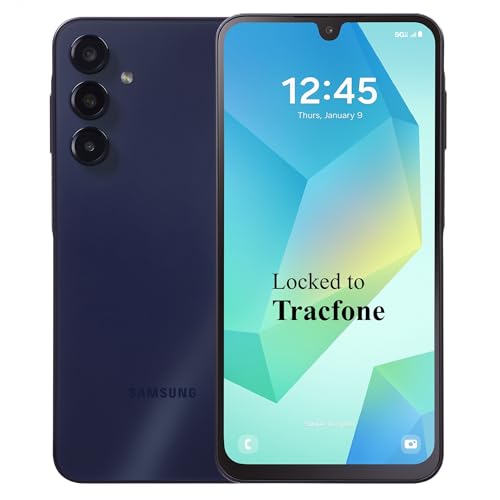
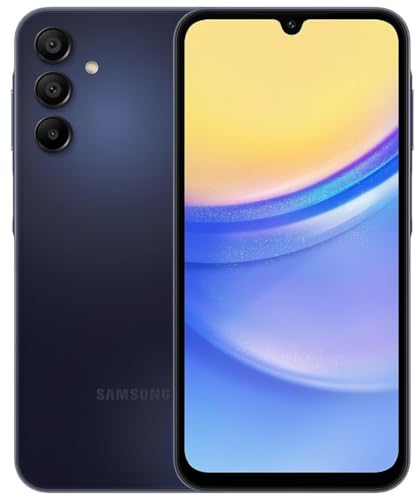
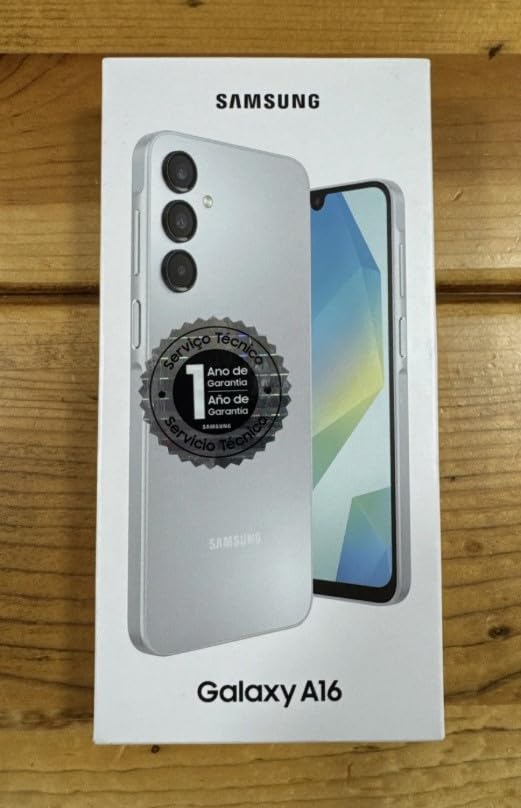


Product shelf
All 15 tracked products in this niche.

Samsung Galaxy A14 5G 64GB Black - Unlocked (Renewed)
Samsung
$97.573.9★2,377 reviews

Samsung Galaxy A14 5G 64GB + 4GB RAM Black - Unlocked (GSM Only) (Renewed)
Samsung
$91.764.0★962 reviews

Samsung Galaxy A14 5G Unlocked 6.6-Inch Infinity-V Display 1080x2408 FHD+ PLS LCD Android 13 One UI Core 5 Bluetooth 5.2 64GB ROM 4GB RAM Expandable MicroSD
Samsung
$90.324.0★257 reviews

Samsung Galaxy A15 5G 128GB Blue Black - Unlocked (International Version) (Renewed)
Samsung
$116.134.1★871 reviews
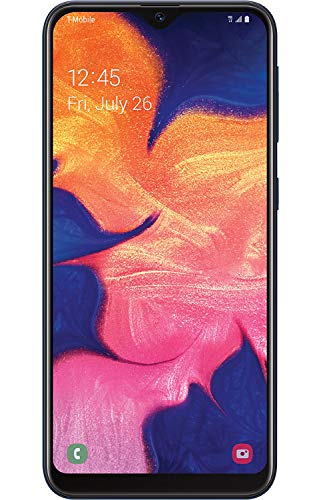
Samsung Galaxy A10e 32GB A102U GSM Unlocked Phone - Black (Renewed)
Samsung
$68.544.0★4,279 reviews

Samsung Galaxy A16 4G LTE (128GB + 4GB) International Model SM-A165F/DS Factory Unlocked 6.7 Dual SIM 50MP Triple Camera (Case Bundle) Black
Samsung
$132.024.4★4,833 reviews
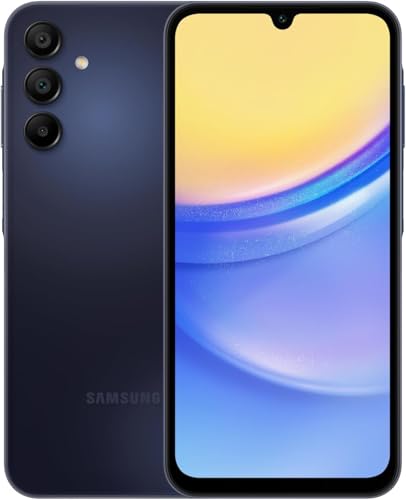
Samsung Galaxy A15 5G 64GB Blue Black - Unlocked (International Version) (Renewed)
Samsung
$104.484.1★37 reviews
Samsung Galaxy A14 5G 64GB + 4GB RAM Black - Locked to Cricket (Renewed)
Samsung
$64.913.9★2,377 reviews
Reviews
What buyers praise and complain about, mined from review topics.What buyers love
“Reasonable price”
“Excellent product”
“True to picture”
“Battery life is great”
“Brand new”
“easy to use”
“camera is great”
“charger which is great”
“Compatible”
“it functions perfectly”
What buyers complain about
“Not compatible with”
“then proceeded to break multiple times after in less than 3 months”
“Connection issues”
“It was a not good product as expected”
“Dont work well”
“it takes hours to charge”
“it is not the same as the one shown in the pictures”
“Apps & features were extremely difficult to navigate for me”
“over priced garbage”
“appears to be used”
Top return reasons
- Compatibility-Overall24%
- Functionality-Overall12%
- Advertised Vs Actual Product9%
- Connectivity-Overall9%
- Charging7%
- Value For Money5%
- Computation Performance4%
- Touch Screen3%
- Size-Overall3%
- Display-Overall3%