iphone 8 plus
Launch it63/100iphone 8 plus clears our launch bar: a $3.7M/yr market growing +83.4% with returns at 1.7%.
Market/yr
$3.7M
Growth (1y)
+83.4%
Products
28
Brands
6
was 8 a year ago
Sellers
170
Price range
$39.79–$404.66
Returns
1.7%
Rating
3.9★
Launch it
Scored 63/100 across market size, growth, competition, quality gap, and returns.
Demand
Weekly Amazon search volume, last 101 weeks — +83.4% year over year.Seasonality
Monthly demand index across the year — 1.00 is average.No pronounced peak months · busiest ÷ quietest = 1.5×
Competition
- Apple65%
- Straight Talk13%
- Plum12%
- AT&T Prepaid8%
- Ubglcs i2%
- Cutwif1%
- Other0%
The top 5 products take 54% of clicks — established leaders, but buyers still shop beyond them. 6 brands and 170 sellers compete here.
Brands
6 falling
was 8 a year ago
Sellers
170
Top 5 brand share
99%




Product shelf
All 28 tracked products in this niche.

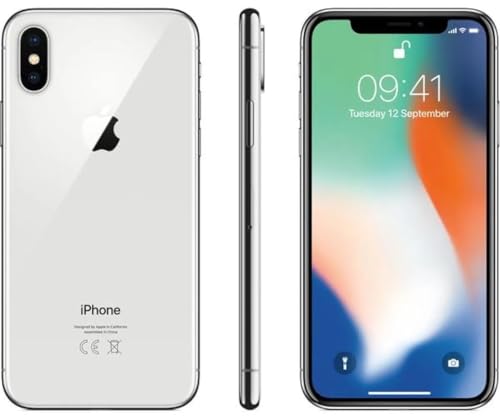
Apple iPhone 7 32GB Unlocked AT&T/T-Mobile - Silver
Straight Talk
$93.303.9★277 reviews

Apple iPhone SE 2nd Generation US Version 64GB Black - Unlocked (Renewed)
Apple
$115.554.2★22,502 reviews

Apple iPhone SE 3rd Gen 64GB Midnight - Unlocked (Renewed)
Apple
$143.174.1★5,601 reviews

Apple iPhone 8 Plus 64GB Space Gray - Unlocked (Renewed)
Apple
$119.623.8★129 reviews

Apple iPhone SE 2nd Generation 64GB White - Unlocked (Renewed)
Apple
$117.114.2★22,502 reviews

Apple iPhone 8 64GB Unlocked - Gray
Plum
$126.034.3★984 reviews
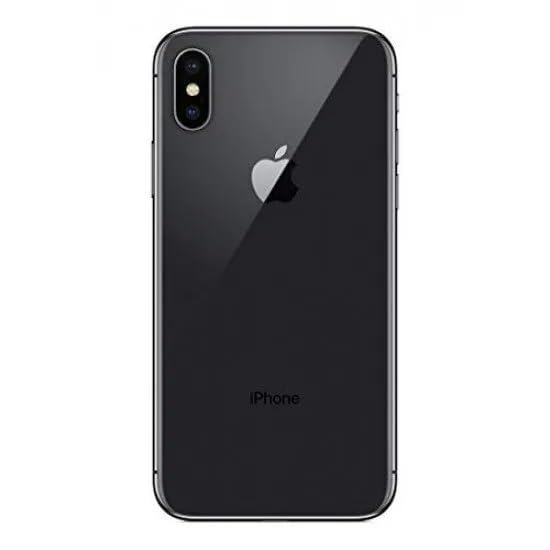
Apple iPhone X 64GB Unlocked - Gray
AT&T Prepaid
$148.523.8★133 reviews

Apple iPhone XR 64GB Black - Unlocked (Renewed)
Apple
$152.194.4★60,898 reviews
Reviews
What buyers praise and complain about, mined from review topics.What buyers love
“Value for money”
“Battery life is amazing”
“Excellent product”
“Brand new phone”
“As advertised”
“Work great no issue over two years”
“Working good”
“it charges pretty fast too”
“Works fine”
“I like the size”
What buyers complain about
“Battery is no good”
“Wont charge”
“Doesnt last”
“Never worked”
“Crap product”
“This phone had a bad wifi”
“with possible extreme overheating”
“Not worth price”
“Sticky buttons”
“Audio quality sucks”
Top return reasons
- Battery Life11%
- Size-Overall11%
- Functionality-Overall10%
- Charging9%
- Value For Money6%
- Touch Screen5%
- Advertised Vs Actual Product4%
- Compatibility-Overall4%
- Touch/Button Controls4%
- Defective Material/Parts3%