iphone 17 pro max screen protector blue light
Worth a look55/100iphone 17 pro max screen protector blue light shows demand growing >1,000%, but a small market ($108K/yr) keeps it on the watch list.
Market/yr
$108K
Growth (1y)
>1,000%
Products
21
Brands
18
Sellers
27
Price range
$5.85–$58.91
Returns
1.7%
Rating
4.2★
Worth a look
Scored 55/100 across market size, growth, competition, quality gap, and returns.
Demand
Weekly Amazon search volume, last 35 weeks — >1,000% year over year.Competition
- Uyiton26%
- Fotbor20%
- ZAGG10%
- JESOHO9%
- PandaShield5%
- SMARTDEVIL5%
- Other (12 brands)26%
The top 5 products take 64% of clicks — established leaders, but buyers still shop beyond them. 18 brands and 27 sellers compete here.
Brands
18
Sellers
27
Top 5 brand share
70%
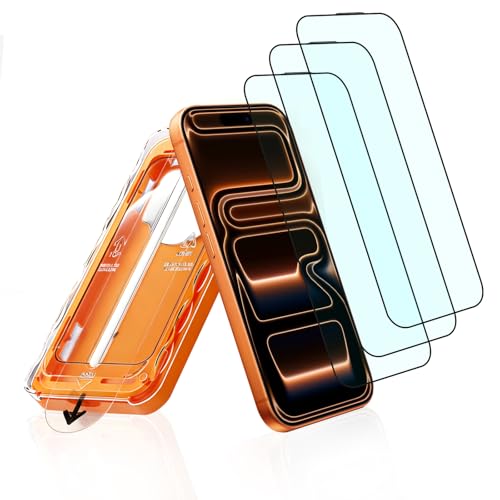
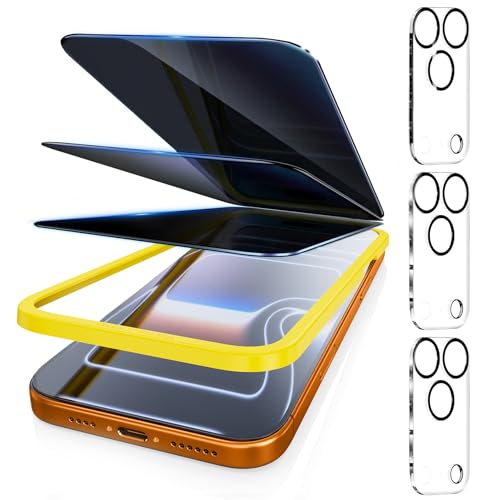
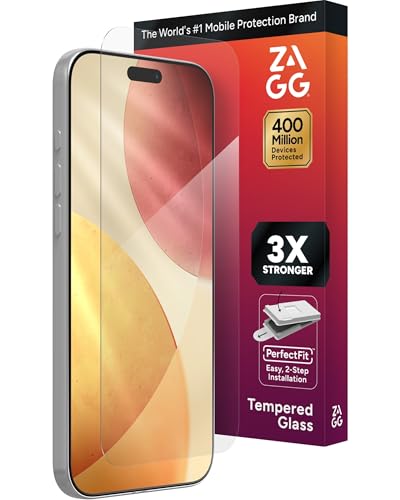
![Milomdoi 3 Pack Gradient Colorful Privacy Screen Protector for iPhone 17 Pro Max [Anti-Blue Light Private Film] 3 Pacs Camera Lens Protector Accessories Case Friendly Anti-Spy Tempered Glass](https://m.media-amazon.com/images/I/51jVsc7EsQL.jpg)
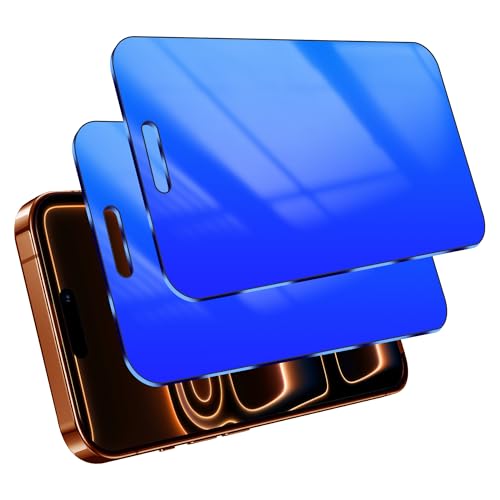
![Upcommon UARMOR Screen Protector for [iPhone 17 Pro Max] Red Light Converter Anti-Blue Light [3X Impact Resistance] 9H Tempered Glass with Easy Installation Kit Full Edge Coverage Fit [2 Pack]](https://m.media-amazon.com/images/I/51v5ofQzD-L.jpg)
![Ailun 3 Pack Screen Protector for iPhone 17 Pro Max [6.9 inch] + 3 Pack Camera Lens Protector with Installation Frame Dynamic Island Compatible Case Friendly[Not for iPhone 17/17 Pro/iPhone Air]](https://m.media-amazon.com/images/I/41E+tcgbdiL.jpg)
Product shelf
All 21 tracked products in this niche.
![Uyiton Compatible with iPhone 17 Pro Max Screen Protector (Anti-Blue Light) - [Easy to Install] Shatterproof Full Coverage [Case Friendly] 9H Tempered Glass Screen Protector for 17 Pro Max 2 Pack](https://m.media-amazon.com/images/I/51LypS+NkWL.jpg)
Uyiton Compatible with iPhone 17 Pro Max Screen Protector (Anti-Blue Light) - [Easy to Install] Shatterproof Full Coverage [Case Friendly] 9H Tempered Glass Screen Protector for 17 Pro Max 2 Pack
Uyiton
$17.104.3★4,968 reviews
![Fotbor [3+3 Pack for iPhone 17 Pro Max Screen Protector Anti-Blue Light [Eye Protection] 9H+ Tempered Glass with Camera Lens Protector](https://m.media-amazon.com/images/I/41gE3+ZiHWL.jpg)
Fotbor [3+3 Pack for iPhone 17 Pro Max Screen Protector Anti-Blue Light [Eye Protection] 9H+ Tempered Glass with Camera Lens Protector
Fotbor
$12.904.4★1,275 reviews
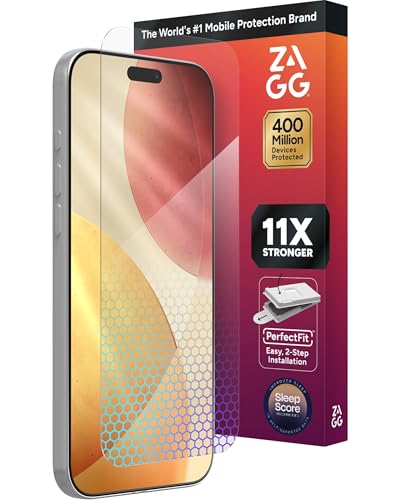
ZAGG XTR5 Screen Protector for iPhone 17 Pro Max - Glass Blue Light Protection 11X Stronger Eyesafe CPF60 Tech Anti-reflective Tech Vibrant Color & Touch Sensitive Tempered Glass Easy To Install
ZAGG
$58.914.0★4,007 reviews
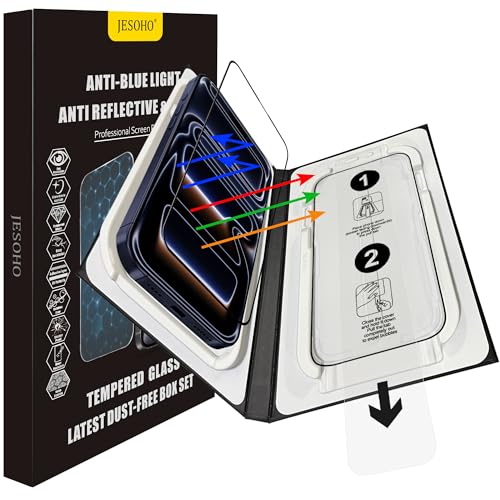
JESOHO Blue Light Blocking Screen Protector for iPhone 17 Pro Max(6.9 inch) Anti Reflective 9H Hardness Shatterproof HD Tempered Glass Easy Install Stain-resistant Scratch Resistant 2 Pack
JESOHO
$13.674.4★1,136 reviews
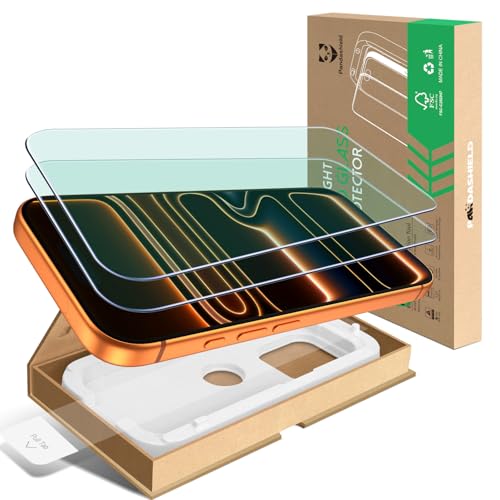
PandaShield 2-Pack Anti-Blue Light(TV RDF-60) Screen Protector for iPhone 16 Pro Max
PandaShield
$24.933.7★72 reviews
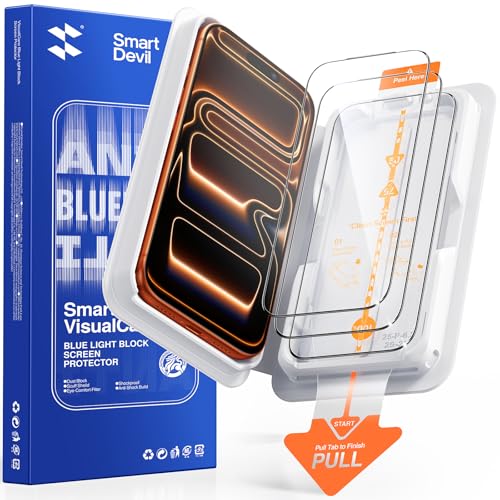
SMARTDEVIL 3 Pack Tempered Glass for iPhone 17 Pro Max Screen Protector Anti Blue Light Eye Protection SGS Military-Grade Shatterproof Fast & Easy Installation Case Friendly Design
SMARTDEVIL
$23.454.6★1,100 reviews
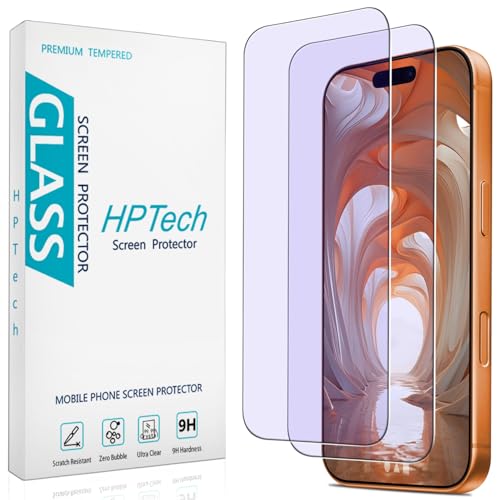
HPTech 2 Pack Anti Blue Light Screen Protector for iPhone 17 Pro Max 6.9 Inch Eye Protection Tempered Glass Film Easy to Install Bubble Free
HPTech
$5.854.0★859 reviews
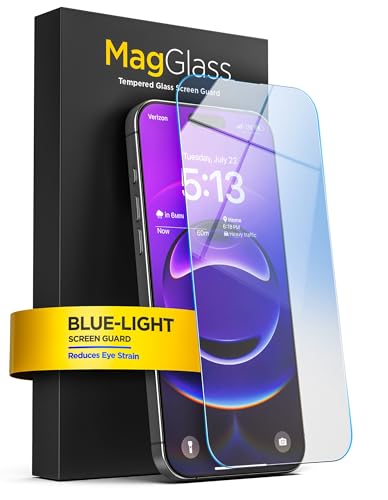
magglass for iPhone 17 Pro Max Screen Protector with Blue-Light Blocking Scratchproof Tempered Glass (Easy Applicator Included)
magglass
$16.703.6★151 reviews
Reviews
What buyers praise and complain about, mined from review topics.What buyers love
“Good Protection”
“Quality is fair”
“Easy to set up”
“Fits as said”
“easy to operate”
“Good value for money”
“hasnt cracked at all”
“As advertised”
“Instructions are clear”
“do their job well”
What buyers complain about
“Breaks easily”
“Bad quality”
“Significantly too big”
“No adhesive”
“This has a higher price point”
“Not very sturdy”
“terrible installation”
“Too thick”
“Inaccurate description”
“Impossible to remove”
Top return reasons
- Size-Overall44%
- Compatibility-Overall12%
- Adhesion/Stickiness8%
- Value For Money7%
- Advertised Vs Actual Product4%
- Defective Material/Parts3%
- Product Condition3%
- Functionality-Overall3%
- Quality-Overall2%
- Durability2%