iphone 17 pro max phone
Launch it81/100iphone 17 pro max phone clears our launch bar: a $15.3M/yr market growing >1,000% with returns at 2.3%.
Market/yr
$15.3M
Growth (1y)
>1,000%
Products
39
Brands
6
was 1 a year ago
Sellers
100
Price range
$9.38–$1792.69
Returns
2.3%
Rating
4.4★
Launch it
Scored 81/100 across market size, growth, competition, quality gap, and returns.
Demand
Weekly Amazon search volume, last 39 weeks — >1,000% year over year.Competition
- Apple59%
- OtterBox30%
- Casely5%
- BURGA4%
- Ailun1%
- kate spade new york1%
The top 5 products take 52% of clicks — established leaders, but buyers still shop beyond them. 6 brands and 100 sellers compete here.
Brands
6 rising
was 1 a year ago
Sellers
100
Top 5 brand share
99%
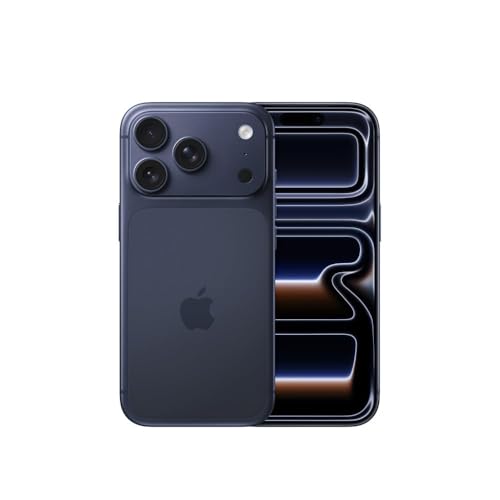
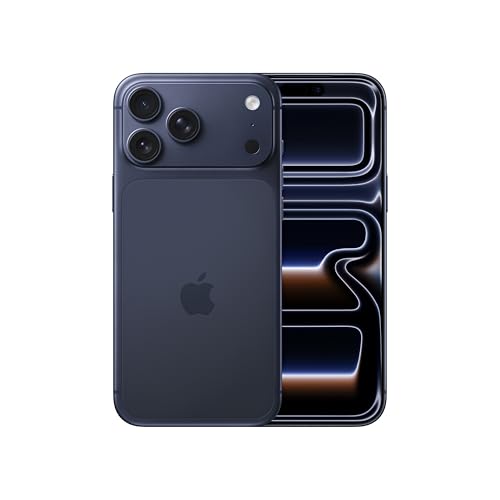

Product shelf
All 39 tracked products in this niche.
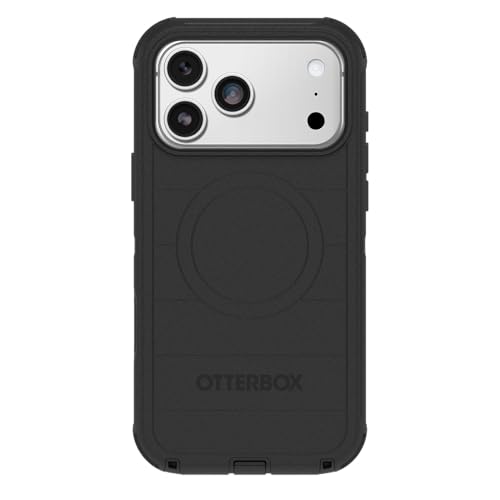
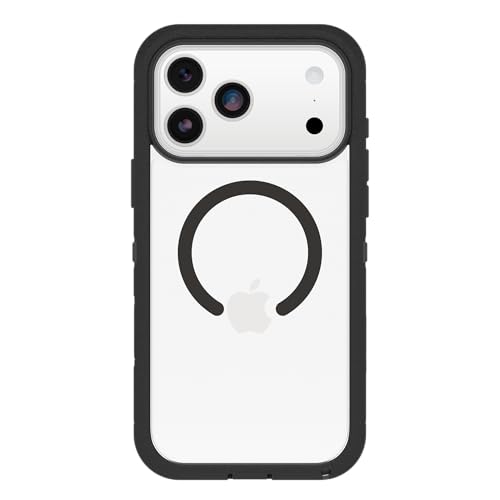
OtterBox iPhone 17 Pro Max Defender Pro Series Case - Black - Tough Rugged & Durable iPhone Case Snaps on MagSafe
OtterBox
$44.004.6★3,269 reviews
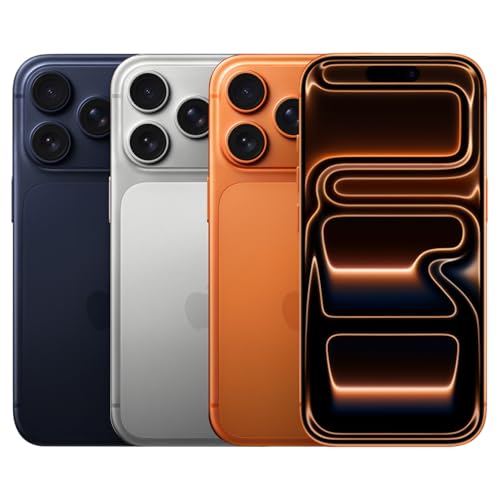
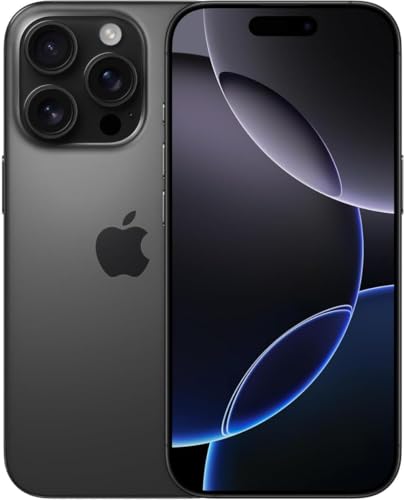
Apple iPhone 17 Pro Max US Version 256GB eSIM Deep Blue- Unlocked (Renewed)
Apple
$1306.434.2★316 reviews
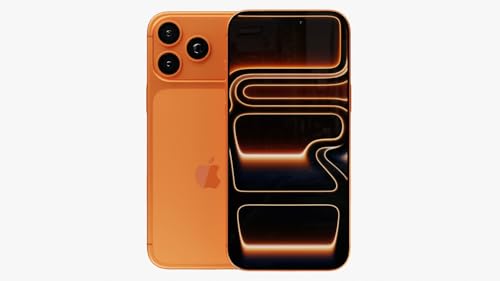
Apple iPhone 17 Pro Max US Version 256GB eSIM Cosmic Orange- Unlocked (Renewed)
Apple
$1351.044.2★316 reviews
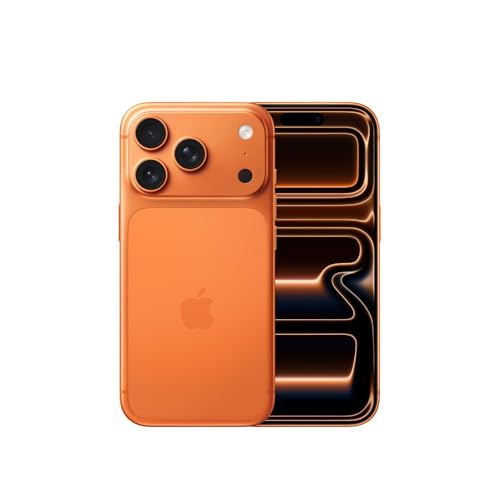
Apple iPhone 17 Pro US Version 256GB eSIM Cosmic Orange- Unlocked (Renewed Premium)
Apple
$1082.584.2★216 reviews
Apple iPhone 17 Pro Max US Version 256GB eSIM Deep Blue- Unlocked (Renewed Premium)
Apple
$1326.734.2★316 reviews
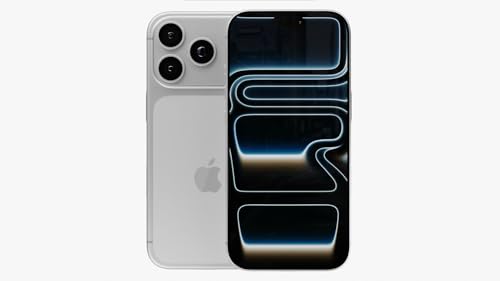
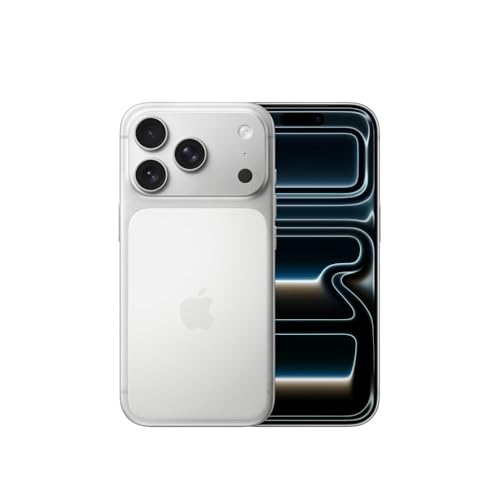
Apple iPhone 17 Pro Max US Version 256GB eSIM Silver- Unlocked (Renewed)
Apple
$1341.334.2★316 reviews
Apple iPhone 17 Pro Max US Version 512GB eSIM Cosmic Orange- Unlocked (Renewed)
Apple
$1526.084.2★316 reviews
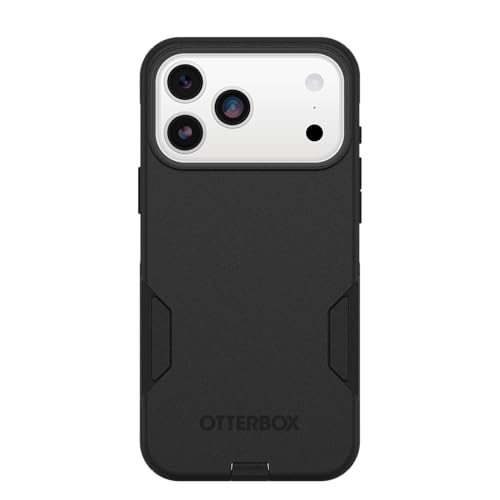
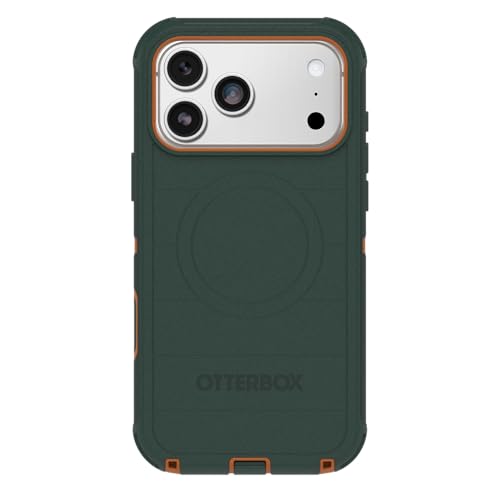
OtterBox iPhone 17 Pro Max Commuter Series Case - Black - Thin & Protective iPhone Case Dual-Layer Impact Absorbing iPhone Case
OtterBox
$40.004.5★3,003 reviews
Reviews
What buyers praise and complain about, mined from review topics.What buyers love
“Excellent Quality”
“Good protection”
“Fits as said”
“Reasonable price”
“Easy to put on”
“Easy peasy”
“Strong durable made of great material”
“does the job”
“Sturdy case”
“Love the color”
What buyers complain about
“Dont last”
“Cheap quality”
“Did not fit”
“a little pricey”
“Not so strong”
“The case does not allow the phone to make the necessary contact to charge”
“Buttons hard to press”
“Impossible to remove”
“No adhesive”
“Terrible audio”
Top return reasons
- Size-Overall38%
- Value For Money8%
- Compatibility-Overall7%
- Advertised Vs Actual Product5%
- Color5%
- Defective Material/Parts3%
- Quality-Overall3%
- Product Condition3%
- Functionality-Overall3%
- Material Quality2%