iphone 15 back glass replacement
Skip it52/100a small market ($37K/yr) — iphone 15 back glass replacement doesn't clear our bar today.
Market/yr
$37K
Growth (1y)
+346.3%
Products
24
Brands
11
was 10 a year ago
Sellers
13
Price range
$12.29–$37.32
Returns
5.6%
Rating
3.8★
Skip it
Scored 52/100 across market size, growth, competition, quality gap, and returns.
Demand
Weekly Amazon search volume, last 11 weeks — +346.3% year over year.Competition
- ReuWeu40%
- Perzework18%
- ZNZHKR15%
- LNONLS6%
- YUZHECHO6%
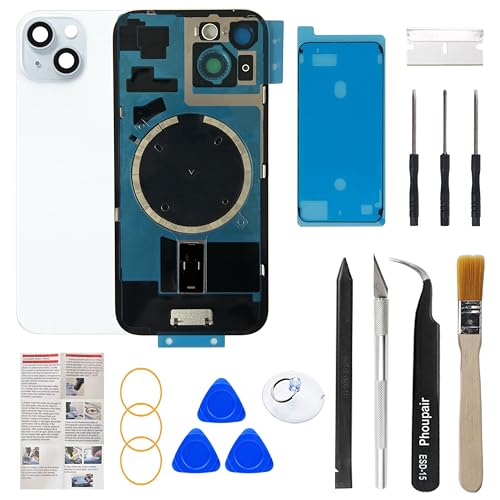
- Phoupair5%
- Other (5 brands)10%
The top 5 products take 57% of clicks — established leaders, but buyers still shop beyond them. 11 brands and 13 sellers compete here.
Brands
11 rising
was 10 a year ago
Sellers
13
Top 5 brand share
85%
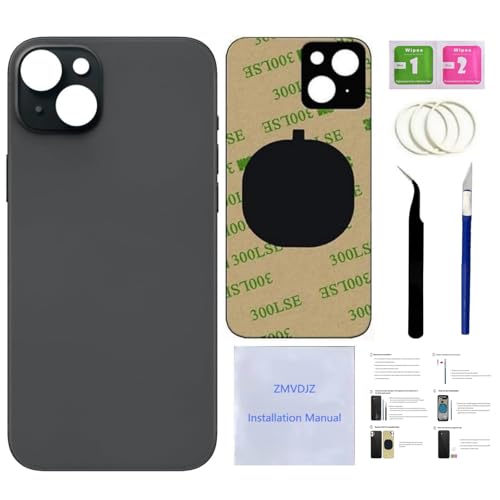

Product shelf
All 24 tracked products in this niche.
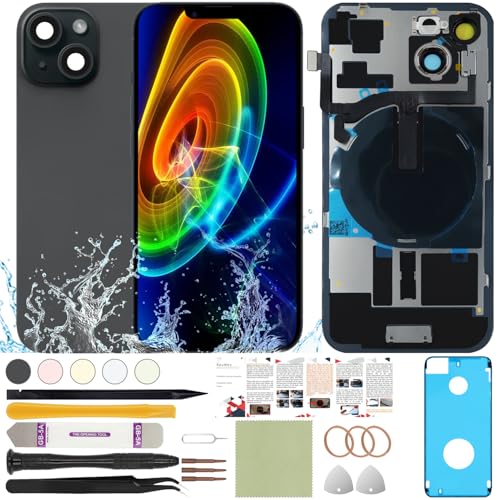
ReuWeu Back Glass Replacement Compatible with iPhone 15 All Carriers 6.1(Black)
ReuWeu
$32.674.1★1,057 reviews
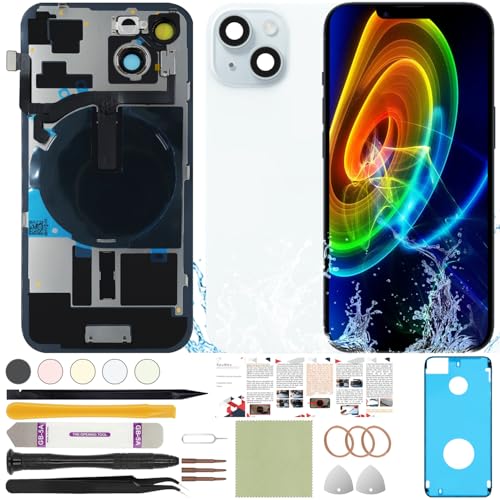
ReuWeu Back Screen Glass Replacement Compatible with iPhone 15 All Carriers 6.1(Blue)
ReuWeu
$32.474.1★1,057 reviews
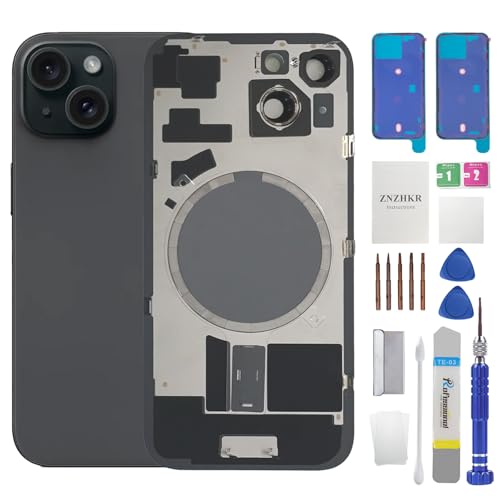
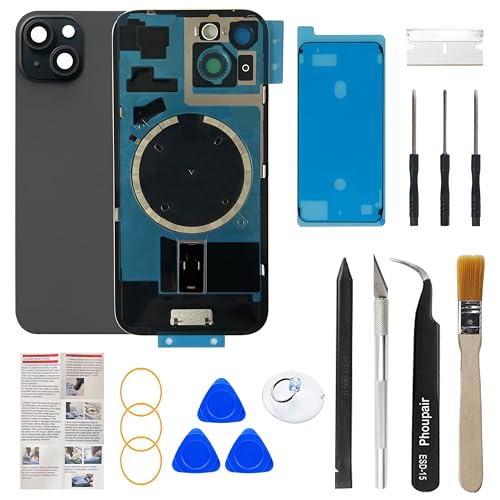
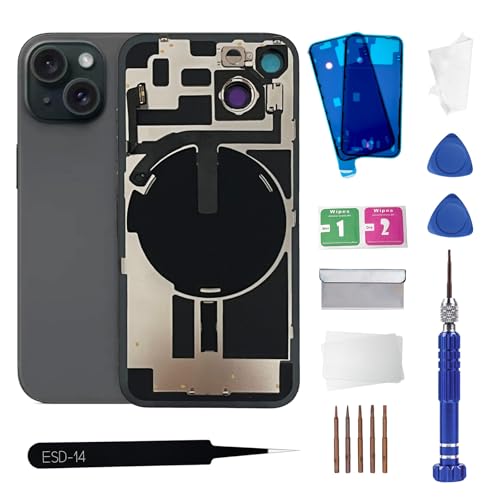
15 Back Glass Replacement with Metal Camera Frame and Lens Glass &Magnet for iPhone 15 (6.1-inch Black) & Includes Replacement Tools
ZNZHKR
$27.693.8★16 reviews
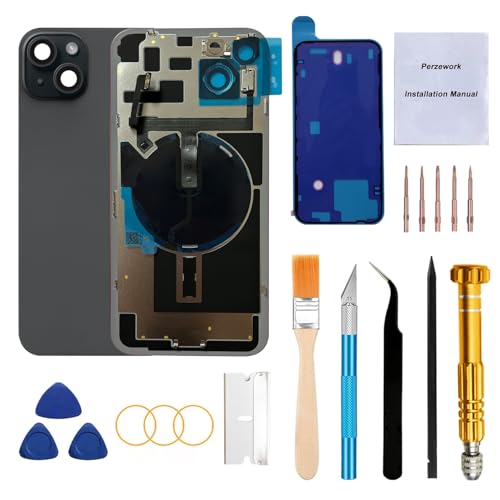
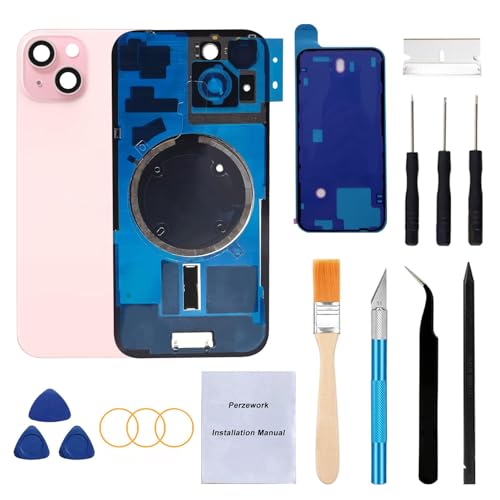
Perzework Rear Back Glass Replacement for iPhone 15 6.1-inches with Reparing Tool Kit and All Necessary Parts (Black)
Perzework
$34.913.8★413 reviews
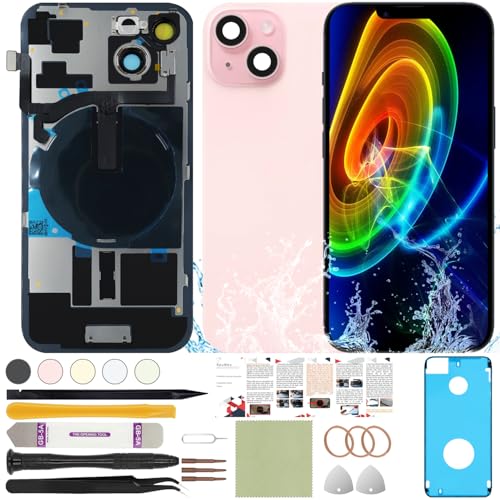
ReuWeu Back Screen Glass Replacement Compatible with iPhone 15 All Carriers 6.1(Pink)
ReuWeu
$32.634.1★1,057 reviews
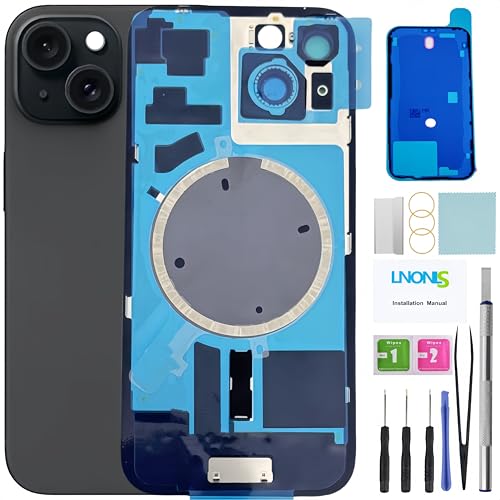
LNONLS 15 Back Glass Replacement for iPhone 15 Rear Back Cover Glass Waterproof and Camera Lens+Professional Repair Tool Kit (Black)
LNONLS
$25.843.9★35 reviews
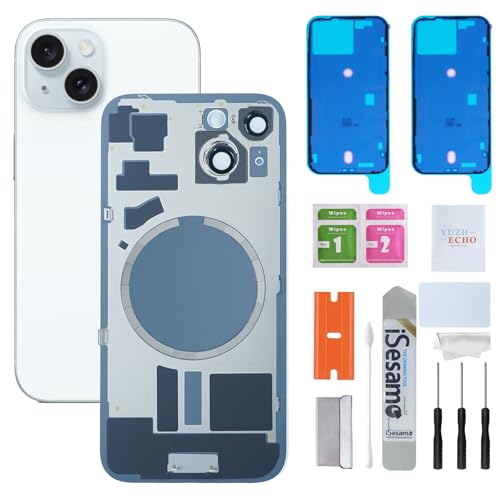
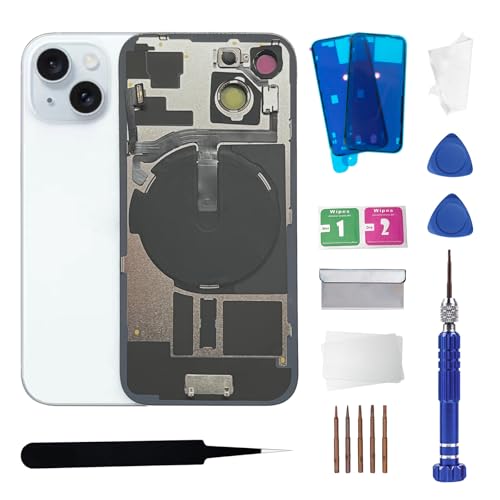
Back Glass Replacement for iPhone 15(6.1 inches Blue) Integrated Glass & Magnet & Metal Phase Ring Repair Tools are Included
YUZHECHO
$24.973.0★4 reviews
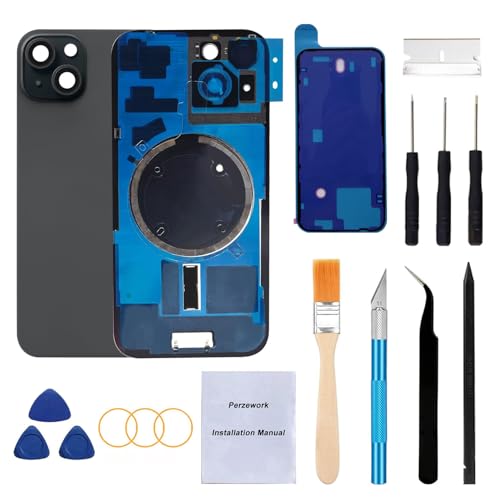
Perzework Rear Back Glass Replacement for iPhone 15 6.1-inches + Pre-Installed Plate and Camera Frame and lens + Reparing Tool Kit (Black)
Perzework
$25.173.9★274 reviews
Reviews
What buyers praise and complain about, mined from review topics.What buyers love
“Easy to install as well and fit perfectly”
“it was extremely easy to do”
“they said everything fit the phone perfect”
“Kit worked great”
“the back panel was solid quality”
What buyers complain about
“Broke right away very cheap”
“poor quality tools”
“The adhesive strips didnt do a good job at holding the glass in”
“Dont use to replace backplate”
“Its most definitely plastic as glass is not flexible”
“Not as described”
“Fragile, will break with the smallest impact”
“didnt fit the piece in my phone”
“Spent hours meticulously installing this only to have it crack / break as I finished installing it”
“Cheap”
Top return reasons
- Defective Material/Parts12%
- Size-Overall10%
- Charging10%
- Color9%
- Functionality-Overall9%
- Compatibility-Overall7%
- Assembly/Installation6%
- Quality-Overall5%
- Durability4%
- Advertised Vs Actual Product3%