apple pencil for ipad 10th
Skip it10/100a small market ($0/yr) — apple pencil for ipad 10th doesn't clear our bar today.
Market/yr
$0
Growth (1y)
-72.4%
Products
1
Brands
1
was 7 a year ago
Sellers
7
Price range
$65.72–$65.72
Returns
3.6%
Rating
4.6★
Skip it
Scored 10/100 across market size, growth, competition, quality gap, and returns.
Demand
Weekly Amazon search volume, last 70 weeks — -72.4% year over year.Seasonality
Monthly demand index across the year — 1.00 is average.Peak months: Feb, Nov, Dec · busiest ÷ quietest = 8.1×
Competition
- Apple100%
The top 5 products capture 100% of clicks — a locked-up shelf that new listings rarely crack. 1 brands and 7 sellers compete here.
Brands
1 falling
was 7 a year ago
Sellers
7
Top 5 brand share
100%
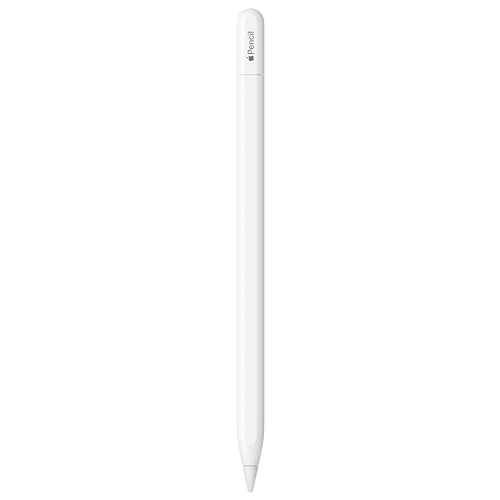
Product shelf
Reviews
What buyers praise and complain about, mined from review topics.What buyers love
“Good savings with good quality”
“compatible with most iPad”
“straightforward with no hassle”
“Great Deal”
“Works like a dream”
“Connection is perfect”
“It charges extremely fast”
“Great battery life”
“Doesnt break as easily”
“I have found it easy to set it and use”
What buyers complain about
“Does not hold charge”
“Not compatible”
“Broke after one week”
“will not pair. yes”
“Not worth the name brand price”
“It never worked”
“It is much lower quality than expected”
“It hardly has any use”
“Full description is wrong”
“Broken doesnt work”
Top return reasons
- Compatibility-Overall53%
- Connectivity-Overall15%
- Functionality-Overall11%
- Charging9%
- Value For Money4%
- Advertised Vs Actual Product2%
- Defective Material/Parts1%
- Product Condition1%
- Size-Overall1%
- Software/Application0%