a15 samsung phone
Skip it39/100a small market ($192K/yr) — a15 samsung phone doesn't clear our bar today.
Market/yr
$192K
Growth (1y)
-1.1%
Products
29
Brands
2
was 1 a year ago
Sellers
157
Price range
$59.51–$174.30
Returns
4.2%
Rating
4.1★
Skip it
Scored 39/100 across market size, growth, competition, quality gap, and returns.
Demand
Weekly Amazon search volume, last 36 weeks — -1.1% year over year.Competition
- Samsung95%
- Tracfone5%
The top 5 products take 51% of clicks — established leaders, but buyers still shop beyond them. 2 brands and 157 sellers compete here.
Brands
2 rising
was 1 a year ago
Sellers
157
Top 5 brand share
100%


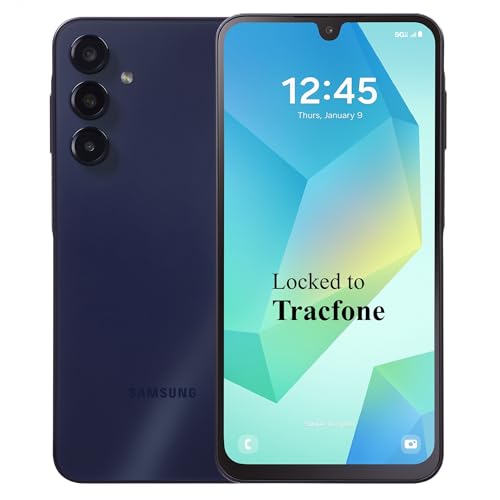


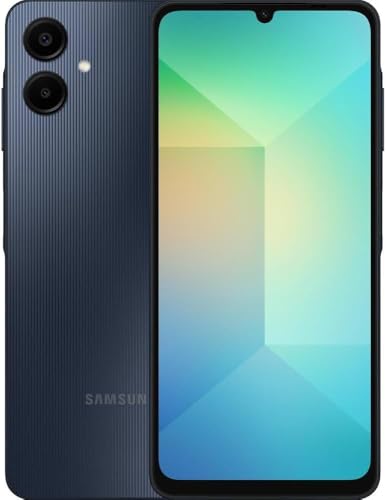
Product shelf
All 29 tracked products in this niche.
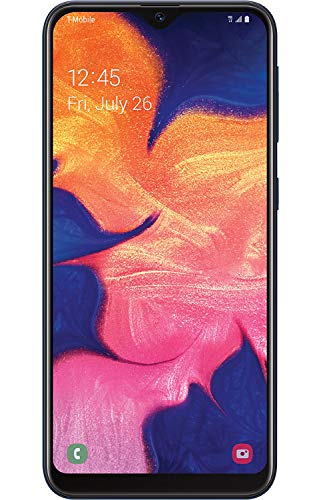
Samsung Galaxy A10e 32GB A102U GSM Unlocked Phone - Black (Renewed)
Samsung
$68.544.0★4,279 reviews

Samsung Galaxy A15 5G 128GB Blue Black - Unlocked (International Version) (Renewed)
Samsung
$116.134.1★871 reviews

Samsung Galaxy A50 64GB Black - Unlocked (GSM Only) (Renewed)
Samsung
$88.524.0★670 reviews

Samsung Galaxy A16 4G LTE (128GB + 4GB) International Model SM-A165F/DS Factory Unlocked 6.7 Dual SIM 50MP Triple Camera (Case Bundle) Black
Samsung
$132.024.4★4,833 reviews
Samsung Galaxy A10e 32GB Black - Unlocked (Renewed)
Samsung
$68.443.9★1,384 reviews
Samsung Galaxy A15 5G 128GB Blue Black - Locked to T-Mobile (Renewed)
Samsung
$93.324.1★871 reviews
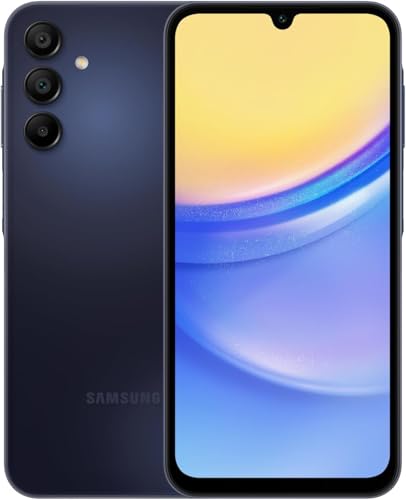
Samsung Galaxy A15 5G 64GB Blue Black - Unlocked (International Version) (Renewed)
Samsung
$104.484.1★37 reviews
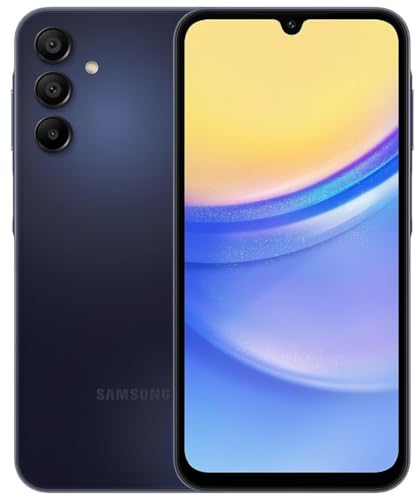
Samsung Galaxy A15 5G (64GB 2024) 6.5 90Hz AMOLED 50MP Camera 4G Volte (Fully Unlocked International Model for AT&T T-Mobile Verizon Global) A156U (Blue Black)
Samsung
$134.624.1★398 reviews
Reviews
What buyers praise and complain about, mined from review topics.What buyers love
“Good for price”
“Excellent product”
“Better than expected”
“Easy to use device”
“Great battery life”
“Brand new”
“the calls are clear”
“Camera is great”
“compatible with the company I use”
“Performance has been smooth for my daily tasks like calls, messages, apps, banking, and streaming”
What buyers complain about
“Not compatible with”
“Did not work”
“the quality is shocking”
“When it doesn't charge”
“Slow Bluetooth connection”
“do wish a little more durable”
“Slow processor”
“When I powered it on the software was buggy”
“Not as advertised”
“Poor battery life”
Top return reasons
- Compatibility-Overall18%
- Functionality-Overall13%
- Connectivity-Overall9%
- Advertised Vs Actual Product8%
- Value For Money7%
- Charging6%
- Computation Performance6%
- Touch Screen4%
- Display-Overall3%
- Software/Application3%