toe straightener
Launch itA $1.3M/yr market growing +44.2% this quarter with returns at 2.0% — clears our launch bar.
Quality gap
Incredible3.7★avg incumbent rating — lower means beatable quality
Market size
Great$1.3M$1.3M/yr · 1.7M searches
Competition
Great34%top-5 click share — an open shelf
Avg price
Great$15.55avg listing price — sweet spot $15–$100
Returns
Good2.0%return rate — above 6% kills the launch gate
Price range
Good$5.18–$36.65cheapest to priciest tracked listing — scored on the share inside $15–$100
Growth
Good+44.2%90-day search growth — must beat 0% to launch
Conversion
Good4.9%search→purchase rate — share of searches ending in a sale
Brand share
Good71%top-5 brand share — brands hold most of the demand
Review moat
Bad5,407.54avg incumbent reviews — the moat a new listing must climb
Competition
Clicks spread well past the top 5 (34% combined) — an open shelf where new products get seen.Brands
24 falling
Sellers
32
Top-5 brand share
71%
Open market
25%
- Hyggear26%
- ZenToes21%
- Welnove14%
- MIND BODHI HEALTH & WELLNESS5%
- TASZOOS4%
- Caretras4%
Product shelf
Each bubble is one product — market share against review moat; bubble size tracks estimated sales, color grades how beatable the incumbent looks.
All 56 tracked products in this niche — three views at once, no toggling.
Top sellers
by 90-day click share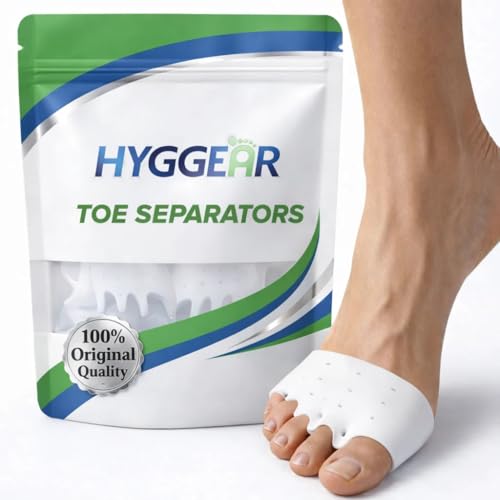
Hyggear Silicone Toe Separators (Left & Right Pair) Toe Spacer for Overlapping Toes Foot Pain Relief for Bunions Hammer Toe & Plantar Fasciitis Comfortable & Breathable for Women & Men
Hyggear$23.433.2★314 rev
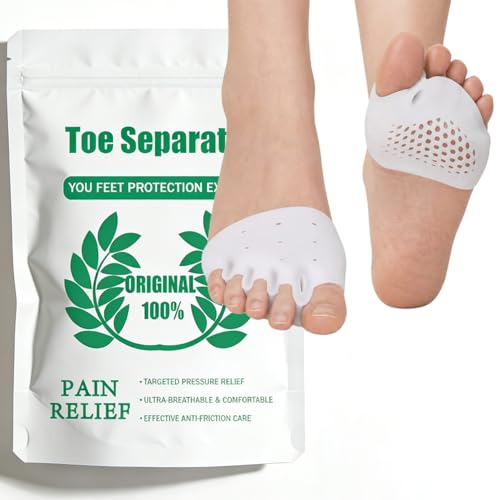
Hyggear - Hygear Silicone Toe Separators For Women & Men Toe Spacers For Overlapping Toes Foot Pain Relief for Bunions Hammer Toe & Plantar Fasciitis Comfortable & Breathable 2-pack Original(White)
Hyggear$25.513.3★83 rev

Welnove Hammer Toe Straightener - 8 Pack Broken Toe Wraps - Hammer Toe Corrector for Women - Toe Splints for Crooked Toes Curled Toes Bent Toes - (Large Beige)
Welnove$10.003.9★1,520 rev

Mind Bodhi Toe Separators/Toe Spacers - For Men and Women - Regular Size Blue
MIND BODHI HEALTH & WELLNESS$9.954.0★48,031 rev
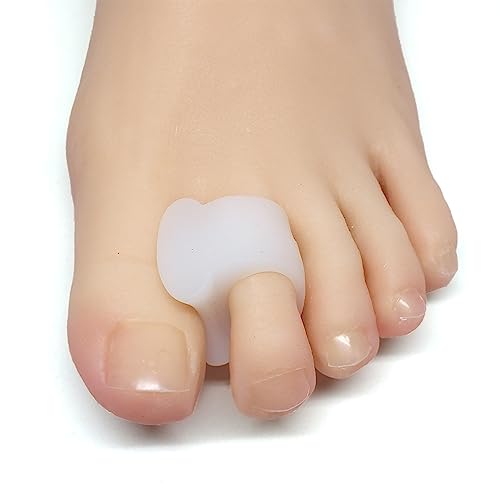
ZenToes Gel Toe Separators for Overlapping Toes Bunions Big Toe Alignment Corrector and Spacer - 4 Pack (White)
ZenToes$13.714.2★30,766 rev
Newest
by launch date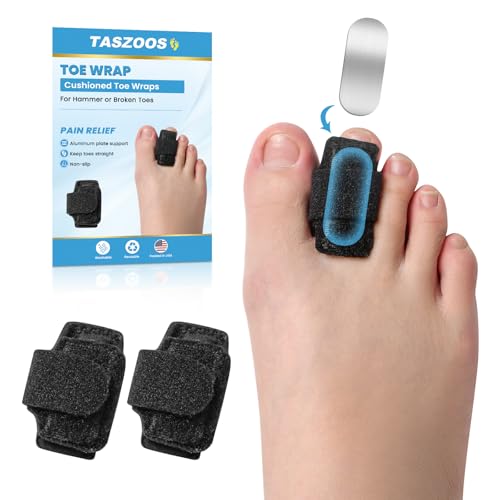
TASZOOS Hammer Toe Straightener Corrector - 2Pcs Hammer Toe Correctors for Women & Men - Toe Splint Relief for Curled Hammer Broken Support - Toe Wrap for Standing Walking Resting
TASZOOS$12.829 rev
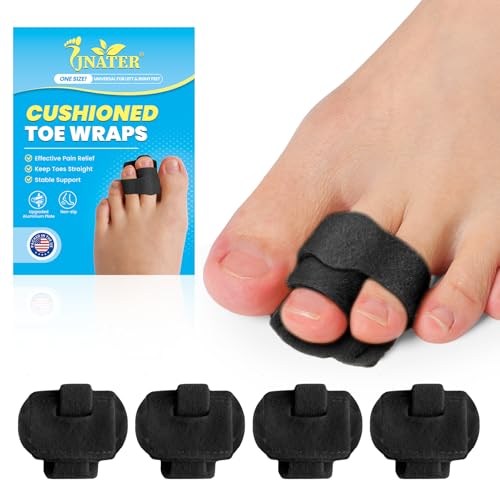
JNATER Hammer Toe Straightener - 2 Pack Hammer Toe Corrector for Women & Men
JNATER$12.0810 rev
TASZOOS Hammer Toe Straightener - 2Pcs Hammer Toe Correctors for Women
TASZOOS$12.8611 rev

Habioer Plantar Fasciitis(1 Pair)
Habioer$15.765 rev
TASZOOS Hammer Toe Straightener - 2Pcs Hammer Toe Corrector for Women & Men - Toe Splints Relief for Hammer Bent Curled Broken Support
TASZOOS$11.4960 rev
Trending
90-day click momentum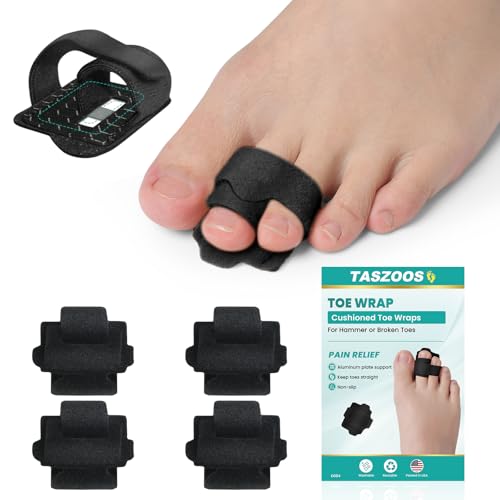
TASZOOS Hammer Toe Straightener - 4 Pcs Non-Slip Toe Splints Wraps Hammer Toe Corrector Relief for Broken Toes Crooked Toes & Overlapping Toes
TASZOOS$14.513.1★
JNATER Hammer Toe Straightener - 2 Pack Hammer Toe Corrector for Women & Men
JNATER$12.082.6★
TASZOOS Hammer Toe Straightener - 2Pcs Hammer Toe Correctors for Women
TASZOOS$12.863.2★

CEYOME 4 Pack Hammer Toe Straightener for Women & Men Soft & Breathable Toe Splint
CEYOME$14.043.0★
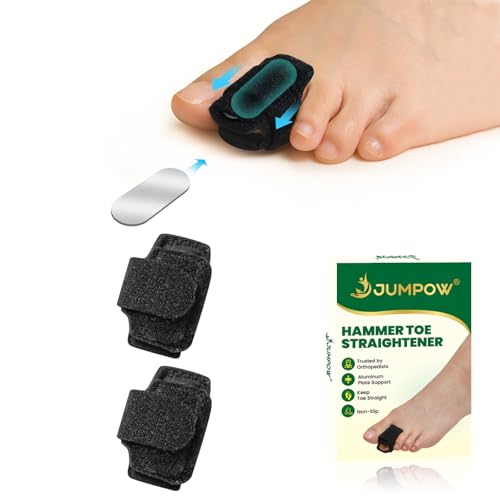
JUMPOW Hammer Toe Straightener for Men & Women - 2 Pcs Hammer Toe Corrector Adjustable Toe Splint Relief for Hammer Curled Bent Broken Support Toe Wrap for Resting Walking Standing
JUMPOW$12.942.5★
Demand & seasonality
Weekly Amazon search volume, last 104 weeks — +44.2% search growth over the last 90 days.Peak months: Jun · busiest ÷ quietest = 1.8×
Reviews
What buyers praise and complain about, mined from review topics.What buyers love
“Comfortable to use”
“Good product ty”
“Works perfectly”
“Easy to Put On”
“It fits all sizes”
“Material is super soft”
“Exactly as advertised”
“Feels good on arthritic toes positioning for relief”
“Best money spent”
“The material is durable”
What buyers complain about
“They are huge”
“Not comfortable to wear”
“it was painful”
“Did Not Work”
“Hard to use”
“Broke after one use”
“over priced”
“Either the product was defective or it is poor quality”
“Very flimsy”
“It is a thicker cream”