toy camera for toddlers 1-3
Skip itA small market ($73K/yr) — this niche doesn't clear our bar today.
Avg price
Incredible$42.51avg listing price — sweet spot $15–$100
Competition
Good48%top-5 click share — leaders hold, buyers still browse
Price range
Good$8.24–$164.50cheapest to priciest tracked listing — scored on the share inside $15–$100
Quality gap
Good4.4★avg incumbent rating — lower means beatable quality
Brand share
Okay77%top-5 brand share — brands hold most of the demand
Returns
Okay4.0%return rate — above 6% kills the launch gate
Review moat
Okay2,566.78avg incumbent reviews — the moat a new listing must climb
Conversion
Okay2.6%search→purchase rate — share of searches ending in a sale
Growth
Bad-6.1%90-day search growth — must beat 0% to launch
Market size
Bad$73K$73K/yr · 66K searches
Competition
The top 5 products take 48% of clicks — established leaders, but buyers still shop beyond them.Brands
19 rising
Sellers
94
Top-5 brand share
77%
Open market
20%
- LeapFrog55%
- WoodenEdu7%
- Baby Einstein6%
- TOP BRIGHT5%
- VTech4%
- Cynzia3%
Product shelf
Each bubble is one product — market share against review moat; bubble size tracks estimated sales, color grades how beatable the incumbent looks.
All 32 tracked products in this niche — three views at once, no toggling.
Top sellers
by 90-day click share
LeapFrog LF920HD Video Baby Monitor 7 HD Screen
LeapFrog$86.544.2★645 rev

LeapFrog LF920-2HD 2-Camera Video Baby Monitor with 7 HD Screen
LeapFrog$164.504.2★645 rev
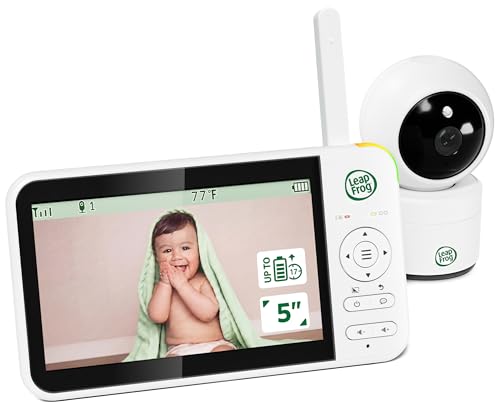
LeapFrog Video Baby Monitor - 5-Inch Color Screen 31-Hour Battery Secure Non-WiFi FHSS Remote Pan Tilt Zoom Night Vision 2-Way Talk | LeapView 360
LeapFrog$48.254.4★35 rev

Wooden Mini Pretend Camera Toy with Real Sounds and Light for Toddlers 3 Years Old Neck Hanging Photographed Props for Boys Girls Children Kids
WoodenEdu$12.614.7★155 rev
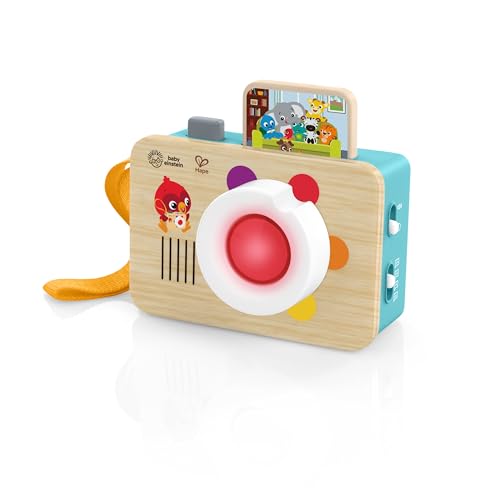
Baby Einstein + Hape Learning Lens Toy Camera for Pretend Play Ages 6 Months and Up
Baby Einstein$14.494.6★105 rev
Newest
by launch date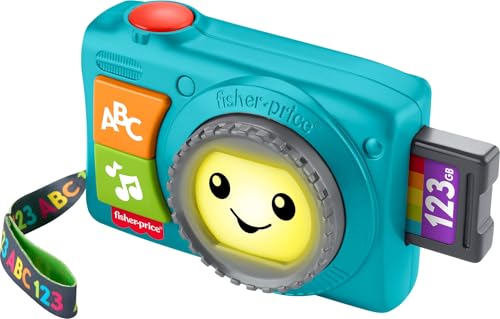
Fisher-Price Baby & Toddler Toy Light-Up Camera Laugh & Learn Musical Learning Activity for Pretend Play Infant Ages 6+ Months
Fisher-Price$10.879 rev
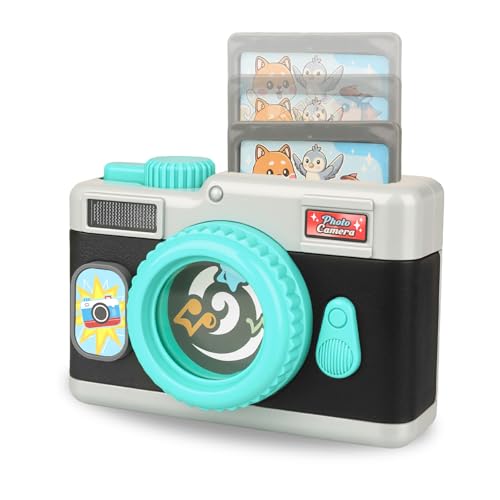
Ella Dream Pretend Play Camera Toy with Sound and Light for Toddlers Kids Babies; Great Gifts for Boys and Girls for Birthday Baby Shower Festival
Ella Dream$8.942 rev
LeapFrog Video Baby Monitor - 5-Inch Color Screen 31-Hour Battery Secure Non-WiFi FHSS Remote Pan Tilt Zoom Night Vision 2-Way Talk | LeapView 360
LeapFrog$48.2535 rev
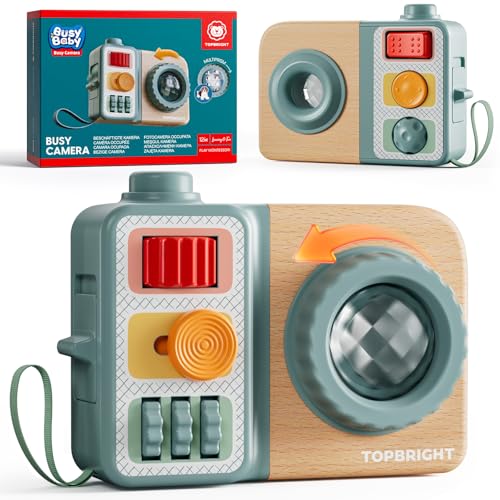
TOP BRIGHT Busy Board for 1 Year Old Montessori Sensory Toys for Toddlers 1-3 Fine Motor Skills Busy Camera Travel Toys for Babies 12-18 Months on Airplane Car 1 Year Old Boy Girl Birthday Gifts
TOP BRIGHT$11.7938 rev
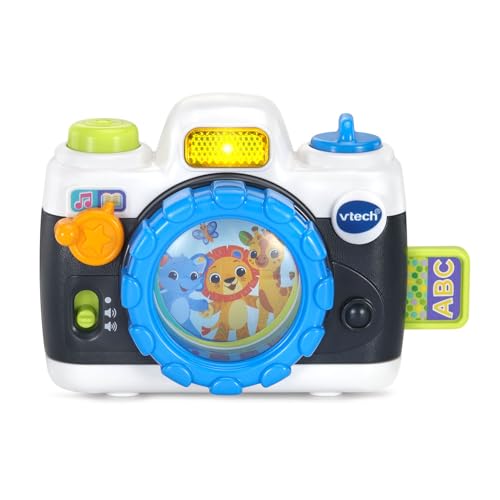
VTech Snap and Giggle Learning Toy Camera with Realistic Sounds Black
VTech$11.0136 rev
Trending
90-day click momentumFisher-Price Baby & Toddler Toy Light-Up Camera Laugh & Learn Musical Learning Activity for Pretend Play Infant Ages 6+ Months
Fisher-Price$10.874.8★
TOP BRIGHT Busy Board for 1 Year Old Montessori Sensory Toys for Toddlers 1-3 Fine Motor Skills Busy Camera Travel Toys for Babies 12-18 Months on Airplane Car 1 Year Old Boy Girl Birthday Gifts
TOP BRIGHT$11.794.7★
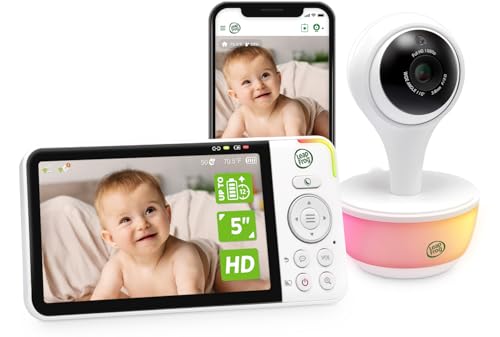
LeapFrog Smart WiFi Baby Monitor 1080p Camera 5-Inch IPS Display Color Night Vision | 5000mAh 22-Hr Battery VOX Mode 110 Wide Angle 8X Zoom Humidity & Temperature | LF815HD
LeapFrog$85.875.0★
LeapFrog Video Baby Monitor - 5-Inch Color Screen 31-Hour Battery Secure Non-WiFi FHSS Remote Pan Tilt Zoom Night Vision 2-Way Talk | LeapView 360
LeapFrog$48.254.4★
VTech Snap and Giggle Learning Toy Camera with Realistic Sounds Black
VTech$11.014.6★
Demand & seasonality
Weekly Amazon search volume, last 104 weeks — -6.1% search growth over the last 90 days.Peak months: Nov, Dec · busiest ÷ quietest = 2.5×
Reviews
What buyers praise and complain about, mined from review topics.What buyers love
“Fun for the whole family”
“the monitor is good quality”
“Easy operation”
“Good value for the price”
“The camera quality is solid”
“GREAT battery life”
“Night vision is solid”
“It does not need assembly”
“Picture quality is great”
“The connectivity is great”
What buyers complain about
“Won't charge”
“breaks easily”
“Low battery life”
“Does not work well”
“Bad quality”
“Bad connection”
“Not worth the price”
“It makes a LOUD static noise every couple minutes”
“buttons stopped working”
“Horrible Picture Quality”