thermometer with app
Skip itBrand-locked demand (top 5 brands take 100% of clicks) — this niche doesn't clear our bar today.
Avg price
Incredible$27.42avg listing price — sweet spot $15–$100
Price range
Great$11.87–$41.45cheapest to priciest tracked listing — scored on the share inside $15–$100
Conversion
Good7.0%search→purchase rate — share of searches ending in a sale
Returns
Good2.2%return rate — above 6% kills the launch gate
Quality gap
Good4.4★avg incumbent rating — lower means beatable quality
Market size
Okay$156K$156K/yr · 82K searches
Review moat
Bad13,269.25avg incumbent reviews — the moat a new listing must climb
Growth
Bad-34.8%90-day search growth — must beat 0% to launch
Competition
Bad94%top-5 click share — a locked-up shelf
Brand share
Bad100%top-5 brand share — brand-locked demand
Competition
The top 5 products capture 94% of clicks — a locked-up shelf that new listings rarely crack.Brands
4 rising
Sellers
23
Top-5 brand share
100%
Open market
0%
- Kinsa85%
- Govee11%
- TempPro3%
- Generic2%
Product shelf
Each bubble is one product — market share against review moat; bubble size tracks estimated sales, color grades how beatable the incumbent looks.
All 8 tracked products in this niche — three views at once, no toggling.
Top sellers
by 90-day click share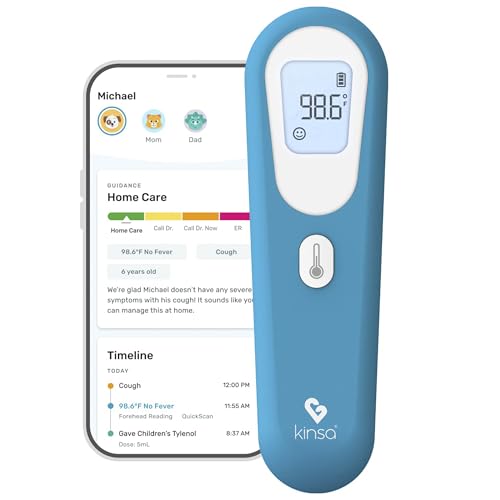
Kinsa QuickScan Smart Forehead Thermometer for Adults Kids and Babies No-Touch Digital Thermometer App-Connected Family Health Tracking Fast Accurate Fever Readings
Kinsa$41.454.4★884 rev

Kinsa Smart Fever Digital Medical Baby Kid and Adult Termometro - Accurate Fast FDA Cleared Thermometer for Oral Armpit or Rectal Temperature Reading - QuickCare
Kinsa$22.424.5★4,656 rev
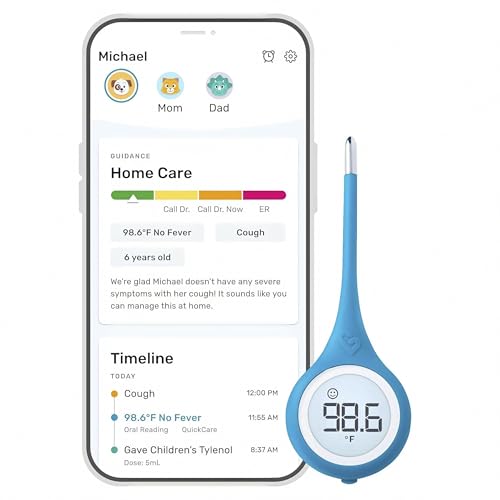
Kinsa QuickCare Smart Digital Thermometer for Adults Kids and Babies Oral Rectal & Underarm Thermometer App-Connected Fever and Symptom Tracking Fast Accurate Readings
Kinsa$24.654.5★2,094 rev

Govee Indoor Hygrometer Thermometer H5075 with Bluetooth App Control
Govee$11.874.5★47,878 rev
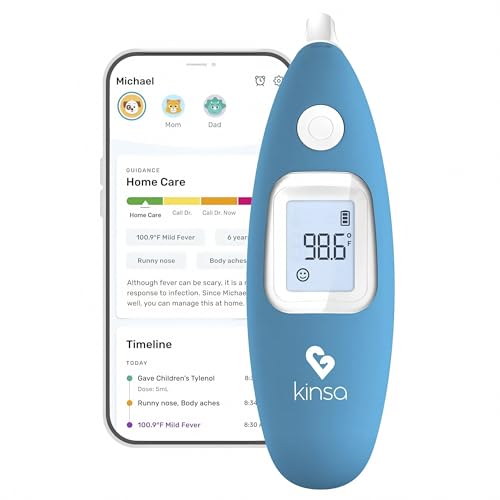
Kinsa Smart Ear Thermometer for Adults Kids and Babies Infrared in-Ear Digital Thermometer App-Connected Fever and Symptom Tracking 1-Second Accurate Readings
Kinsa$39.964.1★1,261 rev
Newest
by launch date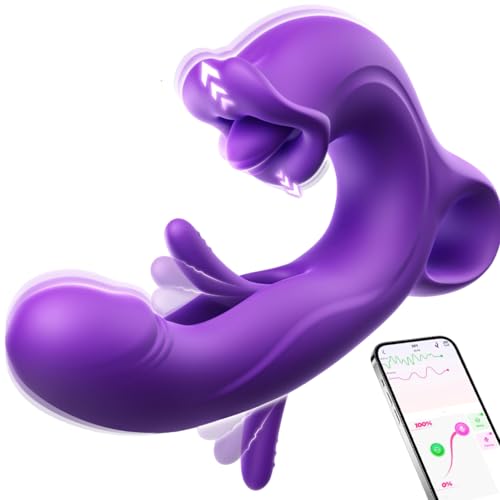
2026 New Upgrade Mode Licking Sensory Toys Woman 7 Mode Clitioral Suck for Women Sucking Toy for Woman Pleasure Adult Toy Adult Toys Sensory for Thrusting Tool TB763
Generic$32.260 rev
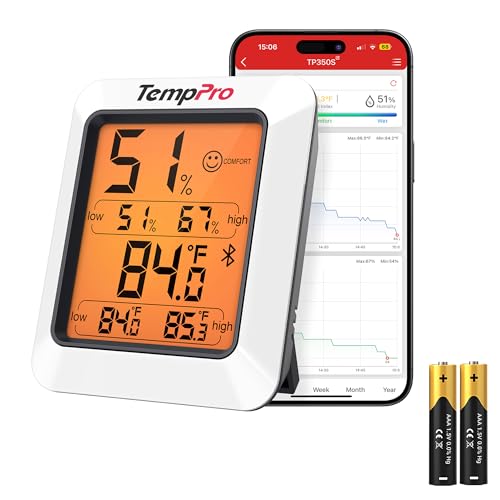
TempPro Hygrometer Thermometer for House Bluetooth Room Indoor Greenhouse Thermometer Monitor Up to 260FT Backlit Humidity Meter Temperature Sensor with 2-Year Data Export(Previously ThermoPro)
TempPro$14.941,503 rev

Govee Indoor Hygrometer Thermometer 3Pack H5075 with Bluetooth App Control
Govee$31.8147,878 rev
Kinsa QuickScan Smart Forehead Thermometer for Adults Kids and Babies No-Touch Digital Thermometer App-Connected Family Health Tracking Fast Accurate Fever Readings
Kinsa$41.45884 rev
Kinsa QuickCare Smart Digital Thermometer for Adults Kids and Babies Oral Rectal & Underarm Thermometer App-Connected Fever and Symptom Tracking Fast Accurate Readings
Kinsa$24.652,094 rev
Trending
90-day click momentum2026 New Upgrade Mode Licking Sensory Toys Woman 7 Mode Clitioral Suck for Women Sucking Toy for Woman Pleasure Adult Toy Adult Toys Sensory for Thrusting Tool TB763
Generic$32.260.0★
Kinsa Smart Fever Digital Medical Baby Kid and Adult Termometro - Accurate Fast FDA Cleared Thermometer for Oral Armpit or Rectal Temperature Reading - QuickCare
Kinsa$22.424.5★
Govee Indoor Hygrometer Thermometer 3Pack H5075 with Bluetooth App Control
Govee$31.814.5★
Govee Indoor Hygrometer Thermometer H5075 with Bluetooth App Control
Govee$11.874.5★
Kinsa QuickScan Smart Forehead Thermometer for Adults Kids and Babies No-Touch Digital Thermometer App-Connected Family Health Tracking Fast Accurate Fever Readings
Kinsa$41.454.4★
Demand & seasonality
Weekly Amazon search volume, last 56 weeks — -34.8% search growth over the last 90 days.Peak months: Jan, Apr · busiest ÷ quietest = 3.5×
Reviews
What buyers praise and complain about, mined from review topics.What buyers love
“Worth the money”
“EXCELLENT PRODUCT”
“As advertised”
“it's so handy”
“Works Great”
“Easy to connect to blue tooth”
“Easy to install”
“Fits anywhere”
“the battery life seems great”
“the display is easy to read”
What buyers complain about
“because this one is constantly disconnecting”
“Broken after 1 use”
“Did not work”
“Battery Life Stinks”
“Terrible Quality Control”
“Doesnt function reliably enough for this cost”
“I cannot speak to the accuracy of the hygrometer”
“Small size”
“Display distorted”
“Ineffective”