teething biscuits for babies 6-12 months
Skip itBrand-locked demand (top 5 brands take 97% of clicks) — this niche doesn't clear our bar today.
Returns
Incredible0.0%return rate — above 6% kills the launch gate
Avg price
Great$17.54avg listing price — sweet spot $15–$100
Conversion
Good6.8%search→purchase rate — share of searches ending in a sale
Price range
Good$4.88–$33.08cheapest to priciest tracked listing — scored on the share inside $15–$100
Review moat
Good1,227.42avg incumbent reviews — the moat a new listing must climb
Competition
Bad75%top-5 click share — a locked-up shelf
Growth
Bad-14.8%90-day search growth — must beat 0% to launch
Quality gap
Bad4.7★avg incumbent rating — lower means beatable quality
Market size
Bad$49K$49K/yr · 42K searches
Brand share
Bad97%top-5 brand share — brand-locked demand
Competition
The top 5 products capture 75% of clicks — a locked-up shelf that new listings rarely crack.Brands
6 falling
Sellers
556
Top-5 brand share
97%
Open market
0%
- Happy Baby44%
- Earth's Best23%
- Gerber19%
- Happy Family6%
- Baby Mum-Mum5%
- Serenity Kids3%
- Open — no brand owns it (0%)
Product shelf
Each bubble is one product — market share against review moat; bubble size tracks estimated sales, color grades how beatable the incumbent looks.
All 12 tracked products in this niche — three views at once, no toggling.
Top sellers
by 90-day click share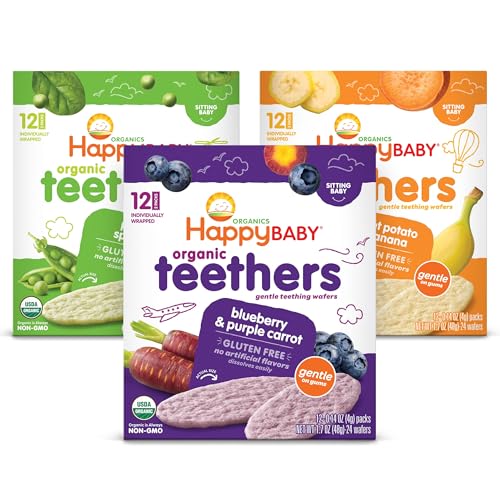
Happy Baby Organics Teether 3 Flavor Variety Pack 12 Count (Pack of 3)
Happy Baby$17.524.8★4,500 rev

Earths Best Organic Baby Food Dissolvable Teething Snack for Babies 6 Months and Older Strawberry Banana Crunchy Sticks .56 oz Pack (Pack of 5)
Earth's Best$10.804.7★1,207 rev

Gerber Strawberry Apple Spinach Teething Wafers 6 Pack
Gerber$20.194.8★2,048 rev

Earths Best Organic Baby Food Dissolvable Teething Snack for Babies 6 Months and Older Garden Veggie Crunchy Sticks .56 oz Pack (Pack of 5)
Earth's Best$8.854.7★711 rev
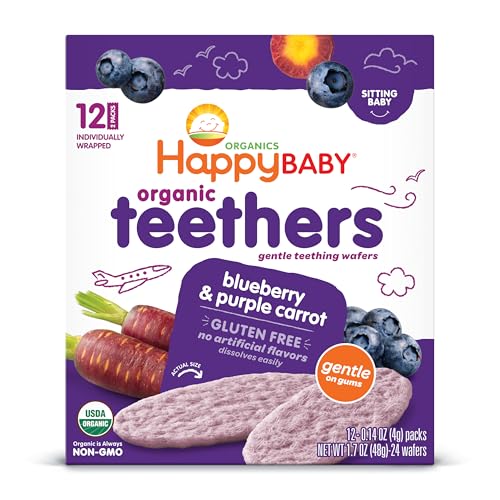
Happy Baby Gentle Teethers Organic Teething Wafers Blueberry and Purple Carrot 12 Count
Happy Family$4.884.8★2,411 rev
Newest
by launch date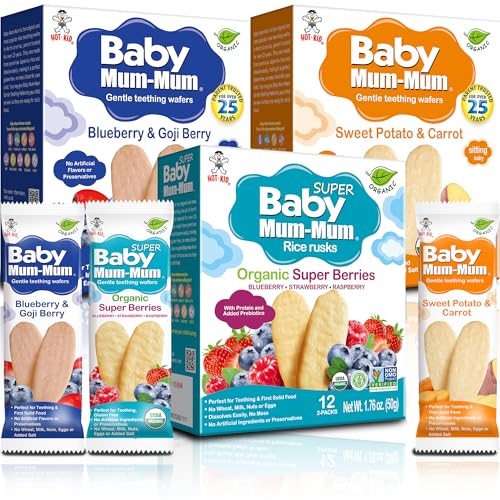
Baby Mum-Mum Organic Gentle Teething Crackers Blueberry & Goji Berry Super Berry Sweet Potato & Carrot Variety Pack | 24 Count (Pack of 3) | Gluten Free Allergen Free Non-GMO
Baby Mum-Mum$21.0837 rev
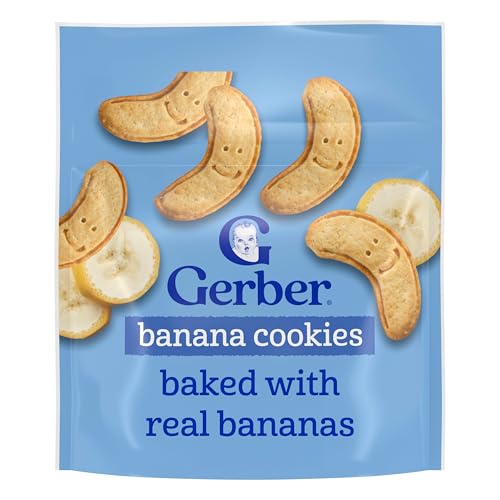
Gerber Toddler Snacks Banana Cookies Toddler Cookies Finger Foods Snacks for Toddlers 4PK
Gerber$11.16128 rev
Earths Best Organic Baby Food Dissolvable Teething Snack for Babies 6 Months and Older Strawberry Banana Crunchy Sticks .56 oz Pack (Pack of 5)
Earth's Best$10.801,207 rev
Earths Best Organic Baby Food Dissolvable Teething Snack for Babies 6 Months and Older Garden Veggie Crunchy Sticks .56 oz Pack (Pack of 5)
Earth's Best$8.85711 rev

Earths Best Organic Baby Food Dissolvable Teething Snack for Babies 6 Months and Older Cheddar Cheese Crunchy Sticks .56 oz Pack (Pack of 5)
Earth's Best$9.95319 rev
Trending
90-day click momentumBaby Mum-Mum Organic Gentle Teething Crackers Blueberry & Goji Berry Super Berry Sweet Potato & Carrot Variety Pack | 24 Count (Pack of 3) | Gluten Free Allergen Free Non-GMO
Baby Mum-Mum$21.084.6★
Gerber Toddler Snacks Banana Cookies Toddler Cookies Finger Foods Snacks for Toddlers 4PK
Gerber$11.164.7★
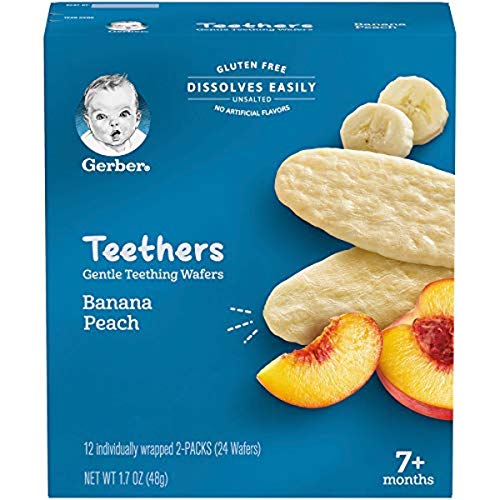
Gerber Snacks for Baby Teethers Gentle Teething Wafers Banana Peach 1.7 Ounce 12 Count Box (Pack of 6)
Gerber$19.764.7★
Earths Best Organic Baby Food Dissolvable Teething Snack for Babies 6 Months and Older Cheddar Cheese Crunchy Sticks .56 oz Pack (Pack of 5)
Earth's Best$9.954.8★
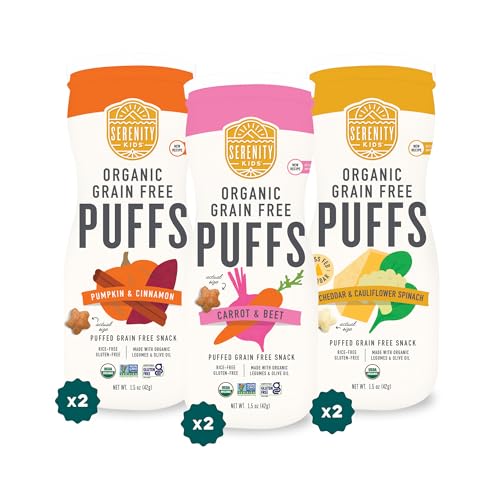
Serenity Kids 6+ Months Baby Puffs - Pack of 6 1.5 Oz Variety Pack - USDA Organic Grain Free Puffs - Healthy Snacks for Kids with Veggies & Olive Oil - Dissolvable Finger Food for Toddler Snacks
Serenity Kids$33.084.6★
Demand & seasonality
Weekly Amazon search volume, last 104 weeks — -14.8% search growth over the last 90 days.No pronounced peak months · busiest ÷ quietest = 1.3×
Reviews
What buyers praise and complain about, mined from review topics.What buyers love
“Great snack”
“Great price”
“Good quality and reasonable price”
“Helps while teething”
“Great flavor”
“Good ingredients”
“good snack”
“Also, crackers dissolve easily when being eaten, eliminating the worry of choking on the crackers”
“they are so convenient”
“actually healthy”
What buyers complain about
“Taste like cardboard”
“They dont stay fresh very long once the bag is opened unless you put them in a ziploc bag”
“They have different flavors too”
“There's an ingredient in it that's apparently bad for you called dicalcium phosphate”
“Causes constipation”
“break it very easily”
“Really expensive”
“Bad quality”
“Horrible smell and taste”
“its very dry”