fisher price sit me up
Skip itBrand-locked demand (top 5 brands take 98% of clicks) — this niche doesn't clear our bar today.
Price range
Incredible$41.22–$75.63cheapest to priciest tracked listing — scored on the share inside $15–$100
Avg price
Great$51.53avg listing price — sweet spot $15–$100
Returns
Okay4.7%return rate — above 6% kills the launch gate
Market size
Okay$144K$144K/yr · 137K searches
Competition
Okay66%top-5 click share — leaders hold, buyers still browse
Conversion
Okay2.0%search→purchase rate — share of searches ending in a sale
Quality gap
Bad4.6★avg incumbent rating — lower means beatable quality
Review moat
Bad11,063.8avg incumbent reviews — the moat a new listing must climb
Growth
Bad-11.7%90-day search growth — must beat 0% to launch
Brand share
Bad98%top-5 brand share — brand-locked demand
Competition
The top 5 products take 66% of clicks — established leaders, but buyers still shop beyond them.Brands
6 rising
Sellers
37
Top-5 brand share
98%
Open market
0%
- Fisher-Price85%
- Bright Starts6%
- Infantino3%
- Nuby2%
- Baby Einstein2%
- Bumbo2%
- Open — no brand owns it (0%)
Product shelf
Each bubble is one product — market share against review moat; bubble size tracks estimated sales, color grades how beatable the incumbent looks.
All 15 tracked products in this niche — three views at once, no toggling.
Top sellers
by 90-day click share
Fisher-Price Portable Baby Chair Sit-Me-Up Floor Seat with Developmental Toys & Machine Washable Seat Pad Rainbow Showers
Fisher-Price$44.894.7★42,825 rev
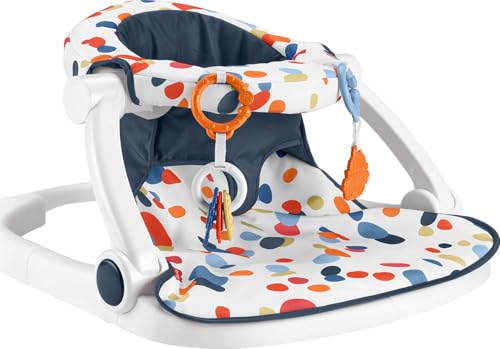
Fisher-Price Portable Baby Chair Darling Dots Sit-Me-Up Floor Seat with BPA-Free Teether & Clacker Newborn Developmental Toys
Fisher-Price$42.064.7★80 rev
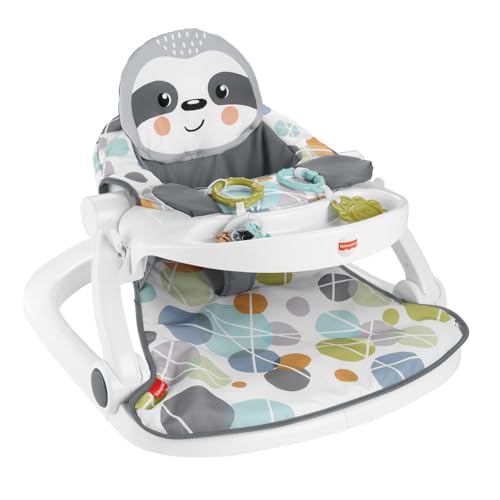
Fisher-Price Portable Baby Chair Sit-Me-Up Floor Seat with Snack Tray Newborn Sensory Activity Toys & Plush Cute Sloth Washable Pad
Fisher-Price$56.484.5★239 rev

Fisher-Price Portable Baby Chair Deluxe Sit-Me-Up Floor Seat with Snack Tray Newborn Activity Toys & Rainbow Sprinkles Washable Pad
Fisher-Price$58.164.5★504 rev
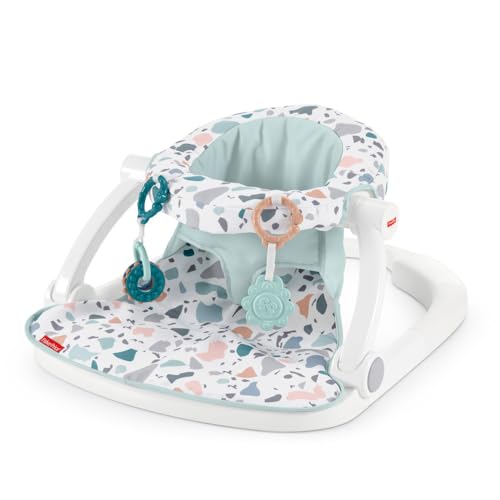
Fisher-Price Portable Baby Chair Sit-Me-Up Floor Seat With Developmental Toys & Machine Washable Seat Pad Pacific Pebble
Fisher-Price$44.664.7★42,825 rev
Newest
by launch dateFisher-Price Portable Baby Chair Darling Dots Sit-Me-Up Floor Seat with BPA-Free Teether & Clacker Newborn Developmental Toys
Fisher-Price$42.0680 rev

Fisher-Price Portable Baby Chair Cute Cow Sit-Me-Up Floor Seat with BPA-Free Teether & Clacker Newborn Developmental Toys
Fisher-Price$44.83219 rev

Bright Starts 3-in-1 SuperSeat Playful Paradise Baby Activity Seat with Toys Snacking Tray Booster Seat BPA Free Tray Unisex 6 Months +
Bright Starts$41.657,610 rev

Baby Einstein SuperSeat Touch of Tunes 3-in-1 Activity Seat with Music & Lights Ages 6 Months and Up
Baby Einstein$53.92618 rev
Fisher-Price Portable Baby Chair Sit-Me-Up Floor Seat with Snack Tray Newborn Sensory Activity Toys & Plush Cute Sloth Washable Pad
Fisher-Price$56.48239 rev
Trending
90-day click momentumFisher-Price Portable Baby Chair Darling Dots Sit-Me-Up Floor Seat with BPA-Free Teether & Clacker Newborn Developmental Toys
Fisher-Price$42.064.7★

Nuby My Floor Seat - Portable Baby Chair with Soft Foam Cushion Safety Harness and High Back Design - 4+ Months - Gray
Nuby$46.044.8★
Fisher-Price Portable Baby Chair Deluxe Sit-Me-Up Floor Seat with Snack Tray Newborn Activity Toys & Rainbow Sprinkles Washable Pad
Fisher-Price$58.164.5★

Fisher-Price Portable Baby Chair Sit-Me-Up Floor Seat with Developmental Toys & Machine Washable Seat Pad Starlight Bursts
Fisher-Price$45.084.7★

Bumbo 3-in-1 Multi-Seat for 6 to 36 Months Travel Baby and Infant Feeding & Play Floor Seat Portable Booster High Chair with Dining and Activity Tray Taupe
Bumbo$67.994.6★
Demand & seasonality
Weekly Amazon search volume, last 84 weeks — -11.7% search growth over the last 90 days.Peak months: Nov · busiest ÷ quietest = 1.9×
Reviews
What buyers praise and complain about, mined from review topics.What buyers love
“Great quality and easy to pack away when not in use”
“Easy to use”
“Great toy overall”
“Super easy to build sturdy”
“Easy to clean”
“Better than imagined”
“Worth the buy”
“comfortable”
“Gives great support”
“Great fit”
What buyers complain about
“Not easy of use”
“It looks so much bigger in the photos”
“Not ideal for any age”
“Not worth the money”
“No assembly”
“disappointed it somewhat broke”
“Poor quality and short circuit or faulty parts/soldering”
“didnt use the straps”
“Too light weight”
“Its bulky and back support is not adjustable”