babysense replacement monitor
Skip itBrand-locked demand (top 5 brands take 100% of clicks) — this niche doesn't clear our bar today.
Avg price
Great$80.03avg listing price — sweet spot $15–$100
Quality gap
Good4.3★avg incumbent rating — lower means beatable quality
Price range
Good$5.79–$141.59cheapest to priciest tracked listing — scored on the share inside $15–$100
Conversion
Good4.4%search→purchase rate — share of searches ending in a sale
Review moat
Okay2,726.45avg incumbent reviews — the moat a new listing must climb
Returns
Bad7.1%return rate — above 6% kills the launch gate
Growth
Bad-21.5%90-day search growth — must beat 0% to launch
Competition
Bad84%top-5 click share — a locked-up shelf
Market size
Bad$29K$29K/yr · 8K searches
Brand share
Bad100%top-5 brand share — brand-locked demand
Competition
The top 5 products capture 84% of clicks — a locked-up shelf that new listings rarely crack.Brands
1 flat
Sellers
2
Top-5 brand share
100%
Open market
0%
- Babysense100%
- Open — no brand owns it (0%)
Product shelf
Each bubble is one product — market share against review moat; bubble size tracks estimated sales, color grades how beatable the incumbent looks.
All 11 tracked products in this niche — three views at once, no toggling.
Top sellers
by 90-day click share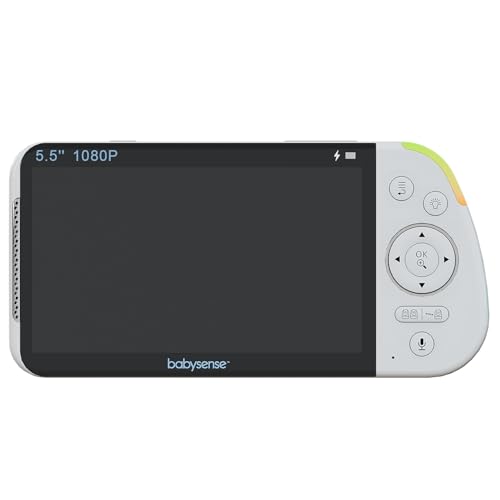
Babysense Replacement Parent Unit
Babysense$98.145.0★1 rev
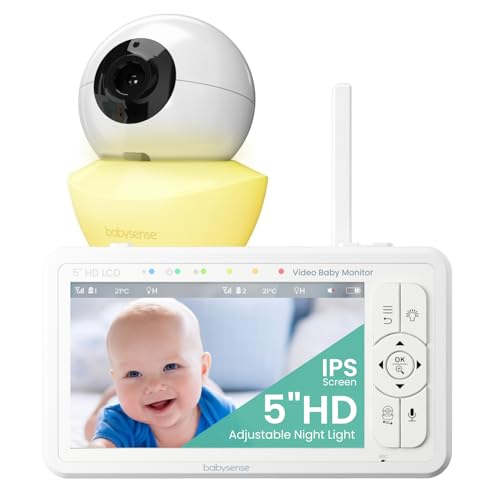
Babysense HD 5 Video Baby Monitor with Camera and Audio No WiFi/App Secure Closed-Loop Night Vision Pan-Tilt-Zoom VOX Audio Alerts White Noise & Lullabies Up to 1000 ft Range 20-Hour Battery
Babysense$87.284.4★7,355 rev

Babysense Parent Unit for Video Baby Monitor Model: V43 Will Not Work with Other Models
Babysense$46.454.3★182 rev

Babysense 5 HD Split-Screen Baby Monitor Video Baby Monitor with 2 Cameras and Audio Night Light 1000ft Range Two-Way Audio 4X Zoom Night Vision 4000mAh Battery
Babysense$141.594.4★7,355 rev

Babysense Parent Unit Prisma Video Baby Monitor
Babysense$78.920.0★0 rev
Newest
by launch dateBabysense Replacement Parent Unit
Babysense$98.141 rev
Babysense HD 5 Video Baby Monitor with Camera and Audio No WiFi/App Secure Closed-Loop Night Vision Pan-Tilt-Zoom VOX Audio Alerts White Noise & Lullabies Up to 1000 ft Range 20-Hour Battery
Babysense$87.287,355 rev
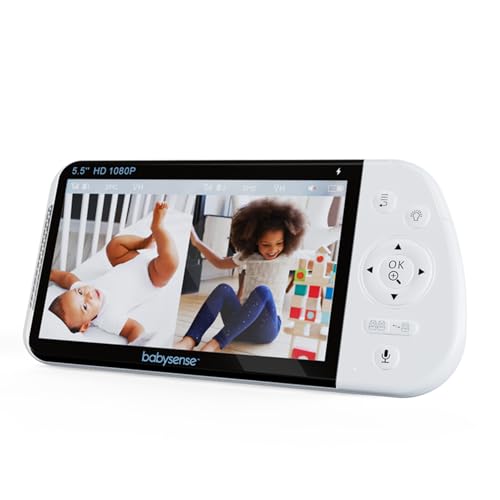
Babysense Replacement Parent Unit for MVPRO Video Baby Monitor
Babysense$98.317 rev
Babysense Parent Unit Prisma Video Baby Monitor
Babysense$78.920 rev
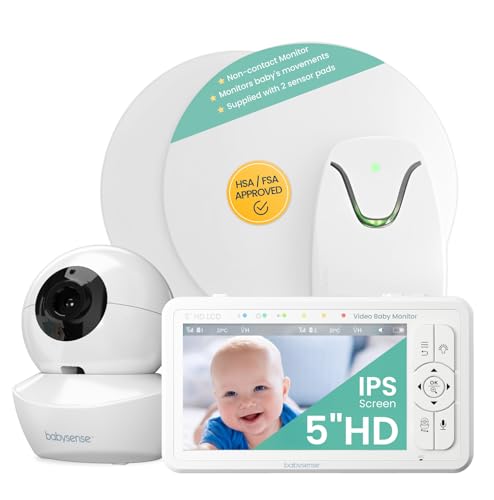
Babysense True Sleep HD FSA Baby Monitor with Camera and Audio + Baby Sleep Breathing Movement Monitor No WiFi 2 Non-Contact Under Mattress Sensors Non-Wearable Monitor Full Crib Coverage
Babysense$140.457,355 rev
Trending
90-day click momentumBabysense HD 5 Video Baby Monitor with Camera and Audio No WiFi/App Secure Closed-Loop Night Vision Pan-Tilt-Zoom VOX Audio Alerts White Noise & Lullabies Up to 1000 ft Range 20-Hour Battery
Babysense$87.284.4★
Babysense Replacement Parent Unit
Babysense$98.145.0★
Babysense True Sleep HD FSA Baby Monitor with Camera and Audio + Baby Sleep Breathing Movement Monitor No WiFi 2 Non-Contact Under Mattress Sensors Non-Wearable Monitor Full Crib Coverage
Babysense$140.454.4★
Babysense Parent Unit Prisma Video Baby Monitor
Babysense$78.920.0★
Babysense 5 HD Split-Screen Baby Monitor Video Baby Monitor with 2 Cameras and Audio Night Light 1000ft Range Two-Way Audio 4X Zoom Night Vision 4000mAh Battery
Babysense$141.594.4★
Demand & seasonality
Weekly Amazon search volume, last 54 weeks — -21.5% search growth over the last 90 days.Peak months: Jan, Nov · busiest ÷ quietest = 2.0×
Reviews
What buyers praise and complain about, mined from review topics.What buyers love
“Great product, I have been using it for over a year”
“Very easy to install”
“Easy to use”
“it connects really good”
“decent battery life”
“Clear picture”
“the clear pictures”
“exactly as described”
“Its definitely worth the investment”
“Also surprisingly durable”
What buyers complain about
“Broke very easily”
“Charging Issues”
“Waste of money”
“would lose connection all the time”
“Battery sucks”
“Disappointed the monitor had great reviews”
“because of this awful, poor functioning and annoying monitor”
“I've done all the troubleshooting and nothing helps; the cameras just quit”
“Speaker already broke - the sound is grainy”
“were starting to have some of the buttons not working or performing functions that arent for the actual button I”